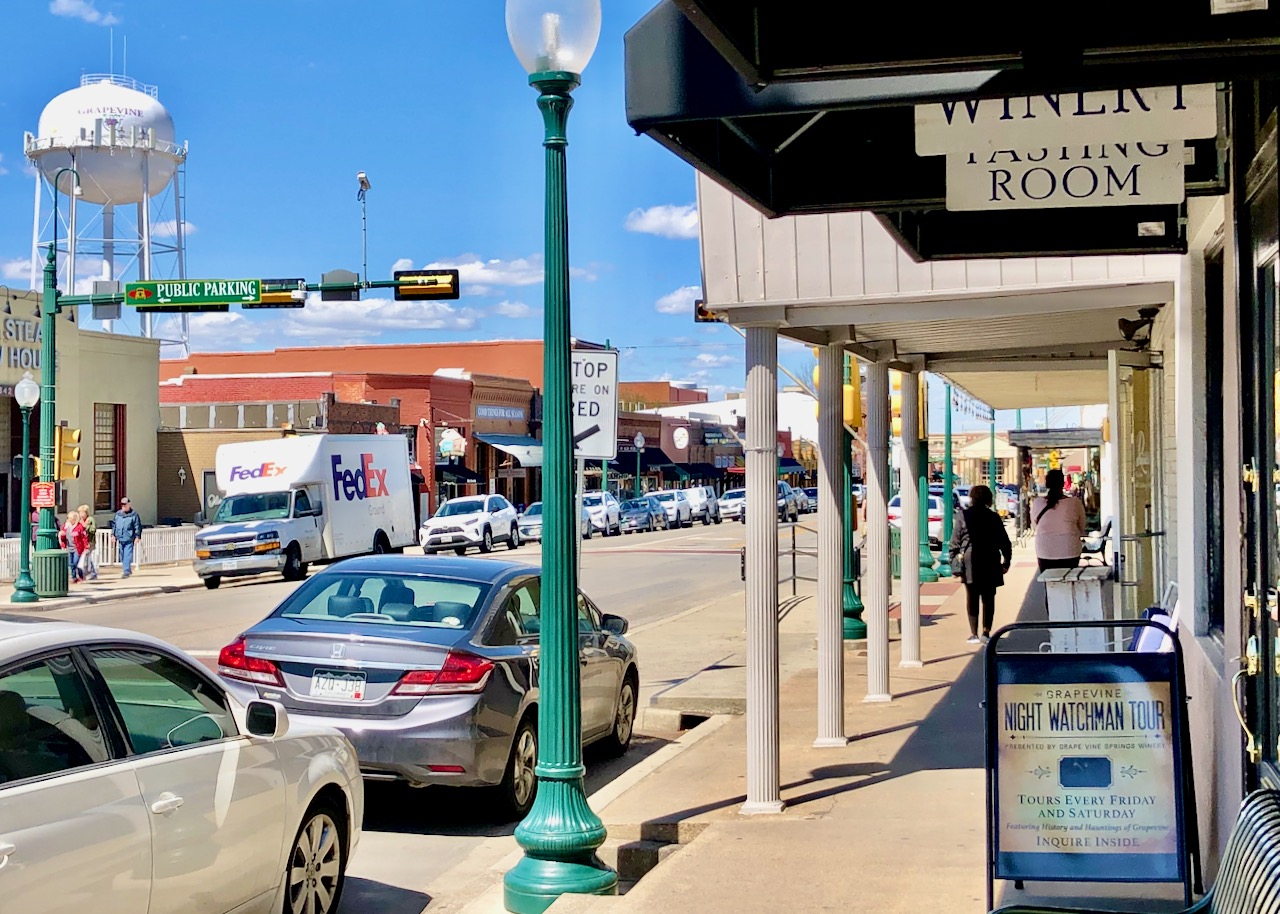
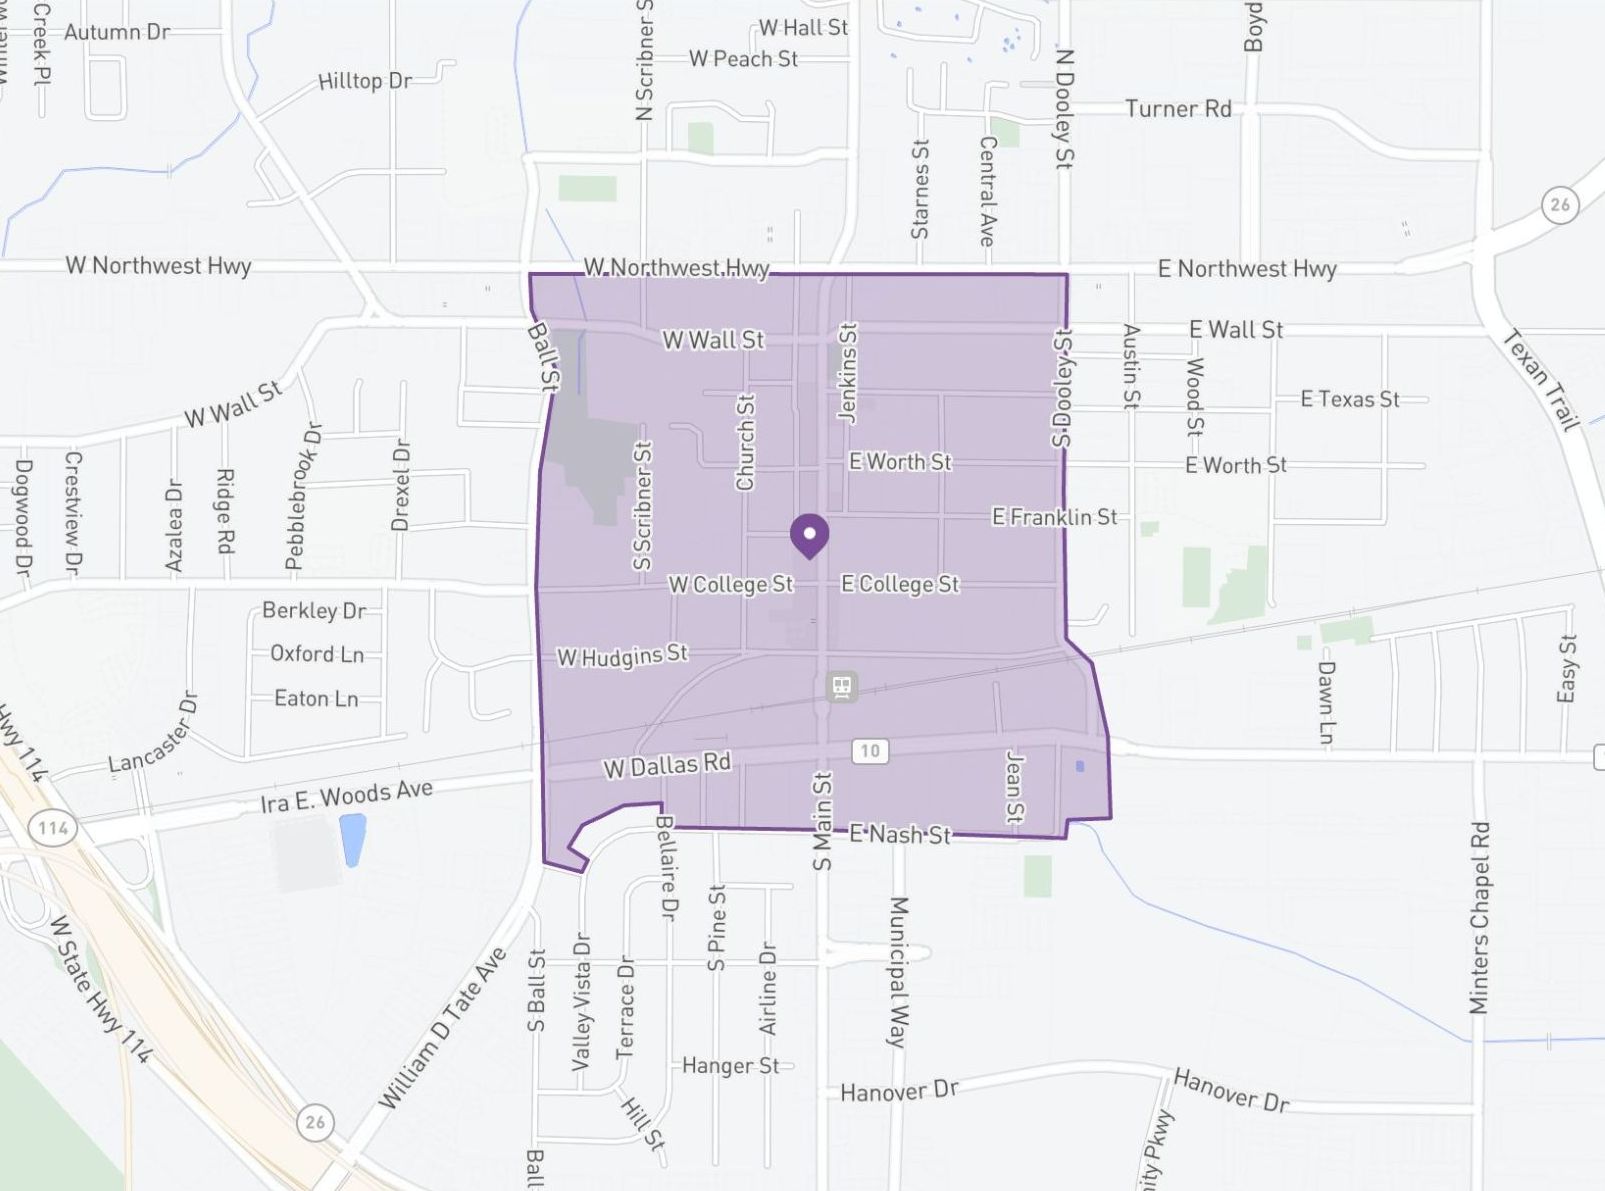
The Historic Central District is Grapevine's Heart & Soul
4 May 2026
News, Blog, Analysis, 2026
There’s never a shortage of things to do in the Historic Central District, even when it isn’t being activated for a major festival. While vacationers and event-based travel are certainly the leading source of foot traffic in the area, it’s worth noting that seven of the top ten destinations in the area last twelve months were independently owned restaurants, and only one of those was a chain. The remaining three popular hangouts? Harvest Hall (23% of visitors), Hotel Vin (16% of visitors), and SONIC (6% of visitors).
Visitor Pattern: Seasonal Surges (YOY visits steady; holiday crowds up 3%)
Best Month in Last 12 (based on sales tax collected): December 2025
Worst Month in Last 12 (based on sales tax collected): August 2025
Top Industries (based on 12m average sales tax collected): General Services, Food, Retail
Key Driver: Events and Activations
FY26 Trends…
- Drawing a Crowd. Major events drive traffic on Main Street, from conferences and conventions in neighboring districts to City-led activations within the area itself. Placer.ai estimates over 350,000 combined attendees at GrapeFest and Main Street Fest in the last 12 full months, plus another 20,000 from the Grapevine Vintage Railroad’s Day Out with Thomas. In all, the Historic Central District garnered an estimated 2.9M visits from 804 unique events in 2025.
- TDO Transformation. Visitation to the area has also grown steadily since TEXRail service began in late 2019, and the HCD was one of the first neighborhoods in Grapevine to reach pre-pandemic foot traffic after COVID restrictions were lifted. In our study window, 77% of visitors to the area were at least 10 miles from home, and 3 in 10 originated over 100 miles away. That’s a higher share of distant visitors than the Districts that house Grapevine Mills and the City’s major convention hotels.
- Christmas Capital. Roughly one in every five visits to the Historic Central District throughout all of 2025 occurred in the final six weeks of the year, when the neighborhood was fully decked out and activated for the Winter holidays. In that span, the average number of visitors was higher for every hour of the day and the percentage of visits per hour shifted dramatically toward the evening (6-10 pm). For a full summary of the Christmas Capital of Texas activation and its impacts last year, scan the QR code on the left.
Top Demographics: American Royalty (16.2%), Philanthropic Sophisticates (8.9%), Influenced by Influencers (7.4%), Across the Ages (7.4%), Sophisticated City Dweller (4.2%)
For a printable version of this analysis, including psychographic information, download our official report. To receive regular updates on the City, upcoming projects, and business tools, subscribe to the ‘Growing Grapevine’ podcast and eNewsletter.
More Topics