Of Mills & Main: Grapevine’s Major Retail Hubs in 12 Charts
4 Oct 2023
Blog, News
No matter where you go in Grapevine, good food and good times aren’t far away. But in terms of sheer cultural and economic capital, two sites stand out as Grapevine’s premiere destinations: Main Street, the heart and soul of the City; and Grapevine Mills, wherein lies the community’s highest concentration of destination entertainment and retail.
The two shopping centers differ in a number of respects, from aesthetic to strategic composition. But they align more closely than the average observer may suspect. Both play a key role in attracting visitors to Grapevine from near and far, and each has a specific niche that compliments the other.
To explain the overlap between the sites, Grapevine Economic Development decided to take a closer look at the centers– and the people who frequent them – using foot traffic estimates from Placer.ai. Here are twelve fascinating charts that explain what makes each location special and how they interact with one another.
Chart 1 – Overall Visits Since 2019
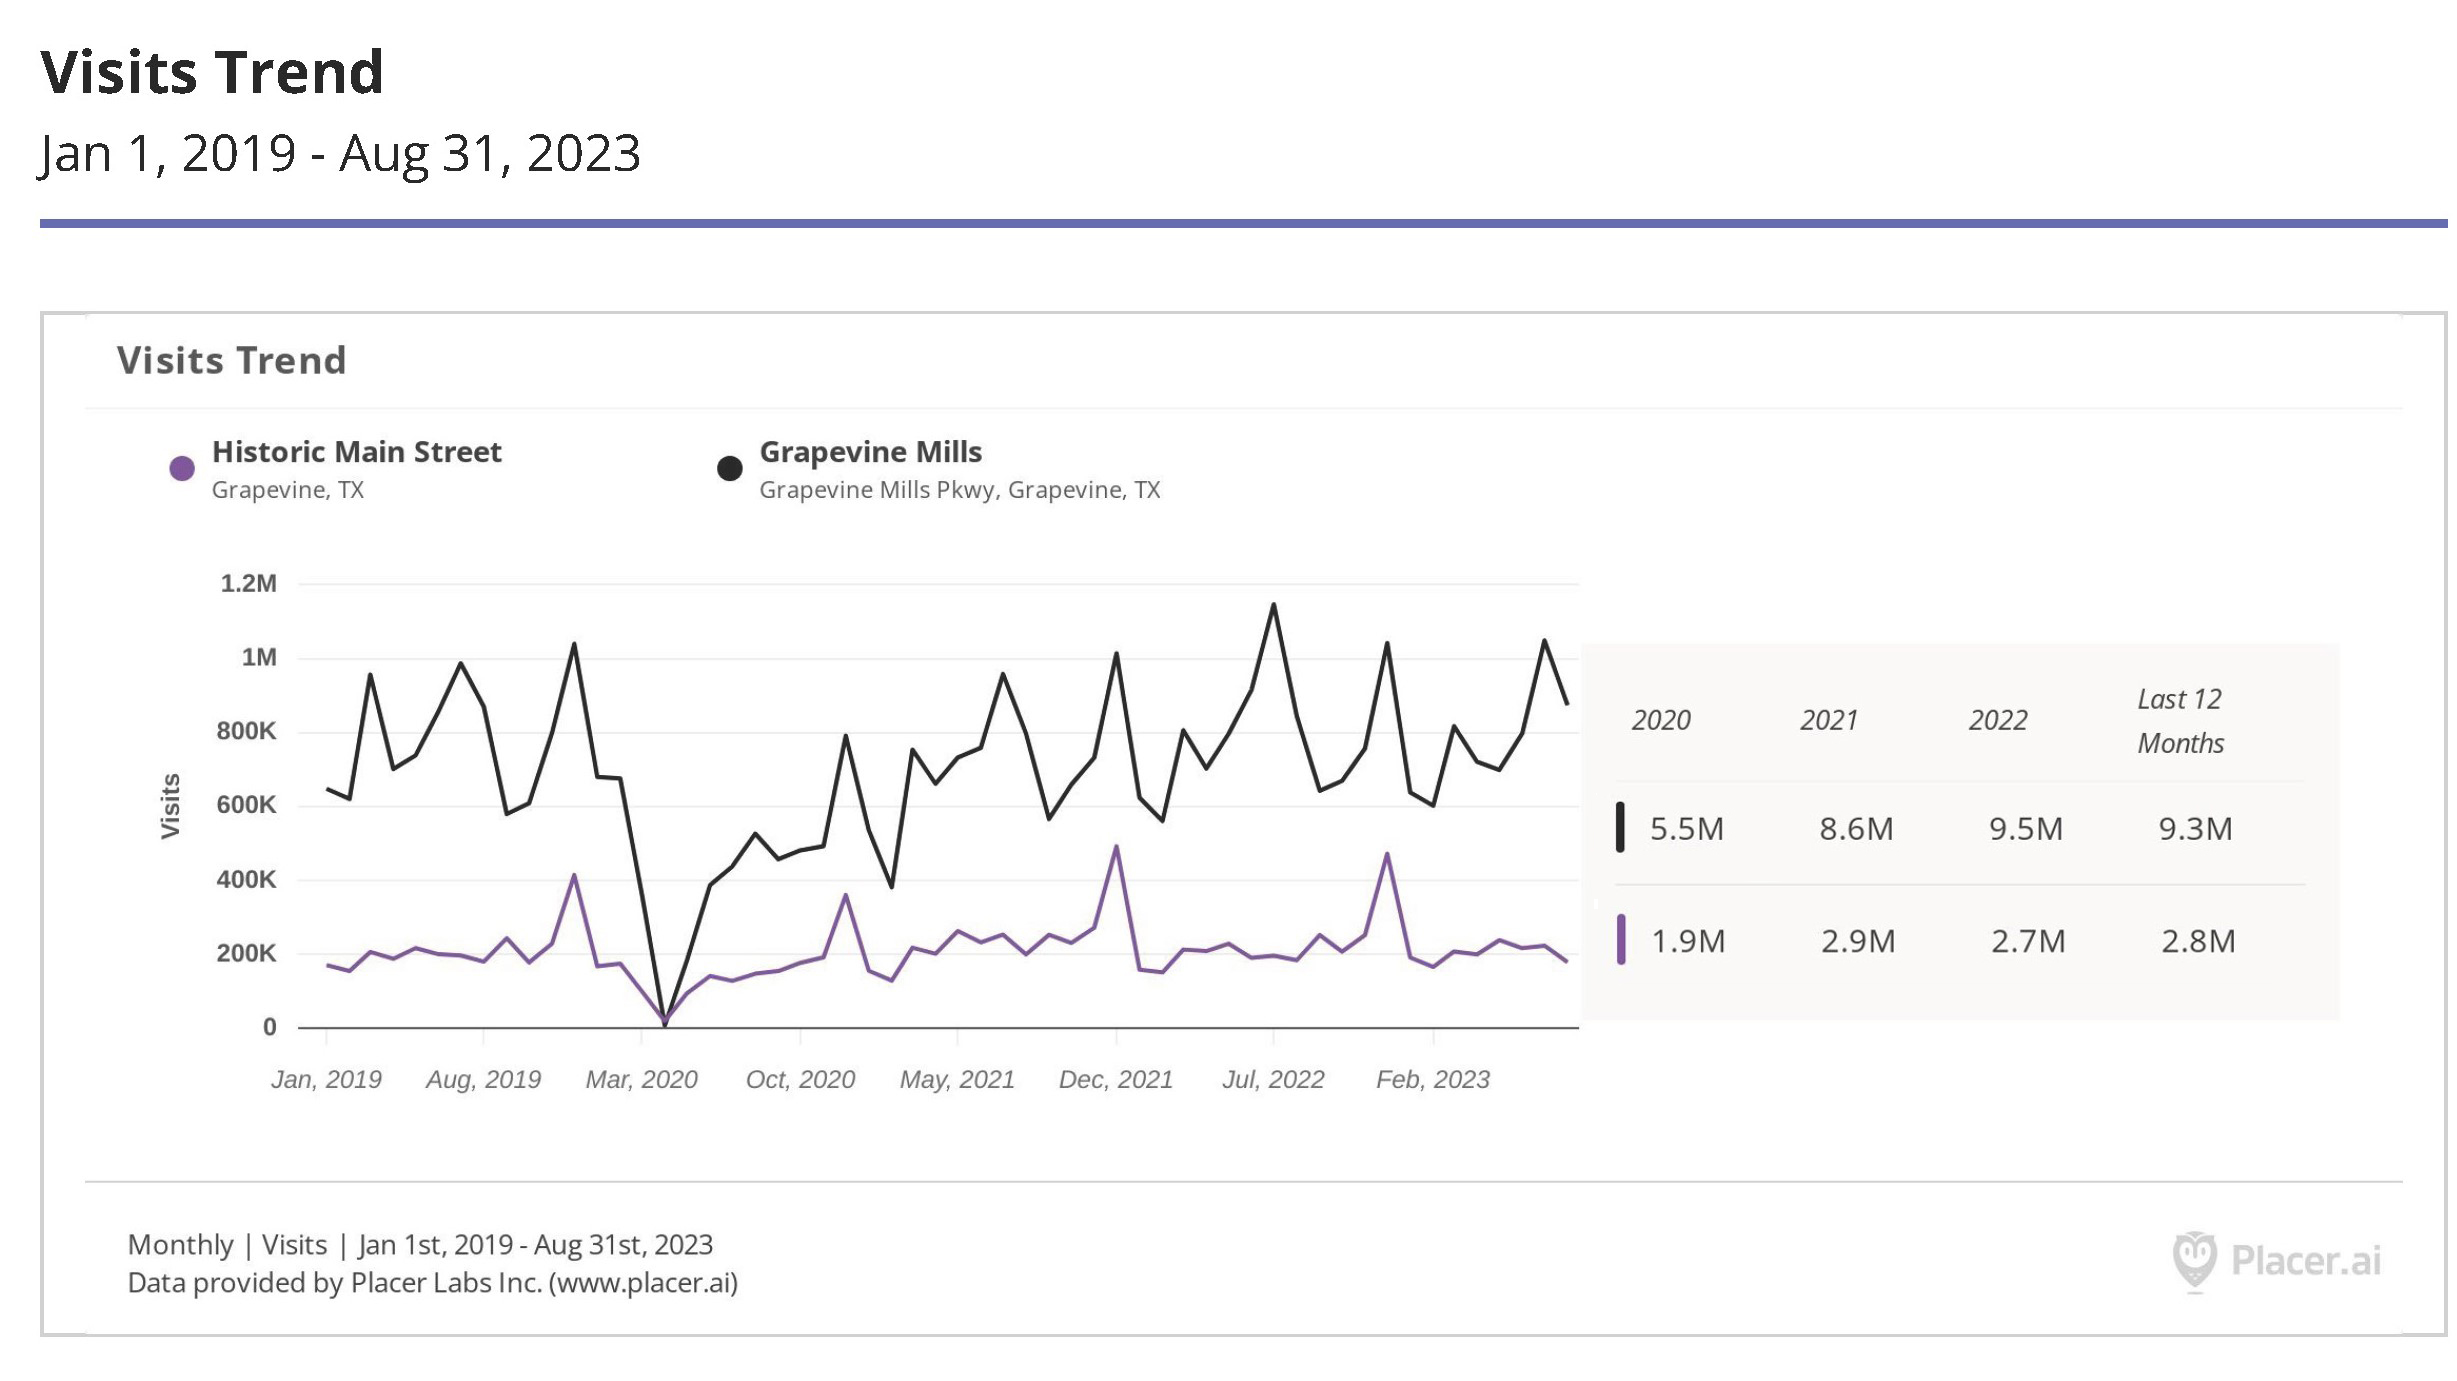
What it is: Monthly foot traffic estimates for Main Street (purple) and Grapevine Mills (black) between January 1, 2019 and August 31, 2023. These are not true counts, but estimates based on a data panel from participating mobile devices.
What it means: Several things stand out as you look at the chart above, the most obvious being the effect of the pandemic shutdown in March of 2020. Beyond that glaring dip in visits, though, the next most obvious and interesting pattern is the mirrorlike relationship between the two curves. In general, Main Street and Grapevine Mills have a symbiotic relationship such that higher traffic in one place will signal corresponding gains in the other.
Caveat: As we dive deeper into this analysis, it’s important to understand what Placer means by “visit.” Generally, their algorithms only log stays of 10-15+ minutes, so drivers passing through Main Street won’t be counted. The system also adjusts for employees; folks who “visit” the same spot on a consistent basis are excluded from these data. Given the variability of part-time labor involved in retail, the exclusion process may not be perfectly clean. But the overall estimates are fairly accurate.
Chart 2 – Baselines & Recovery
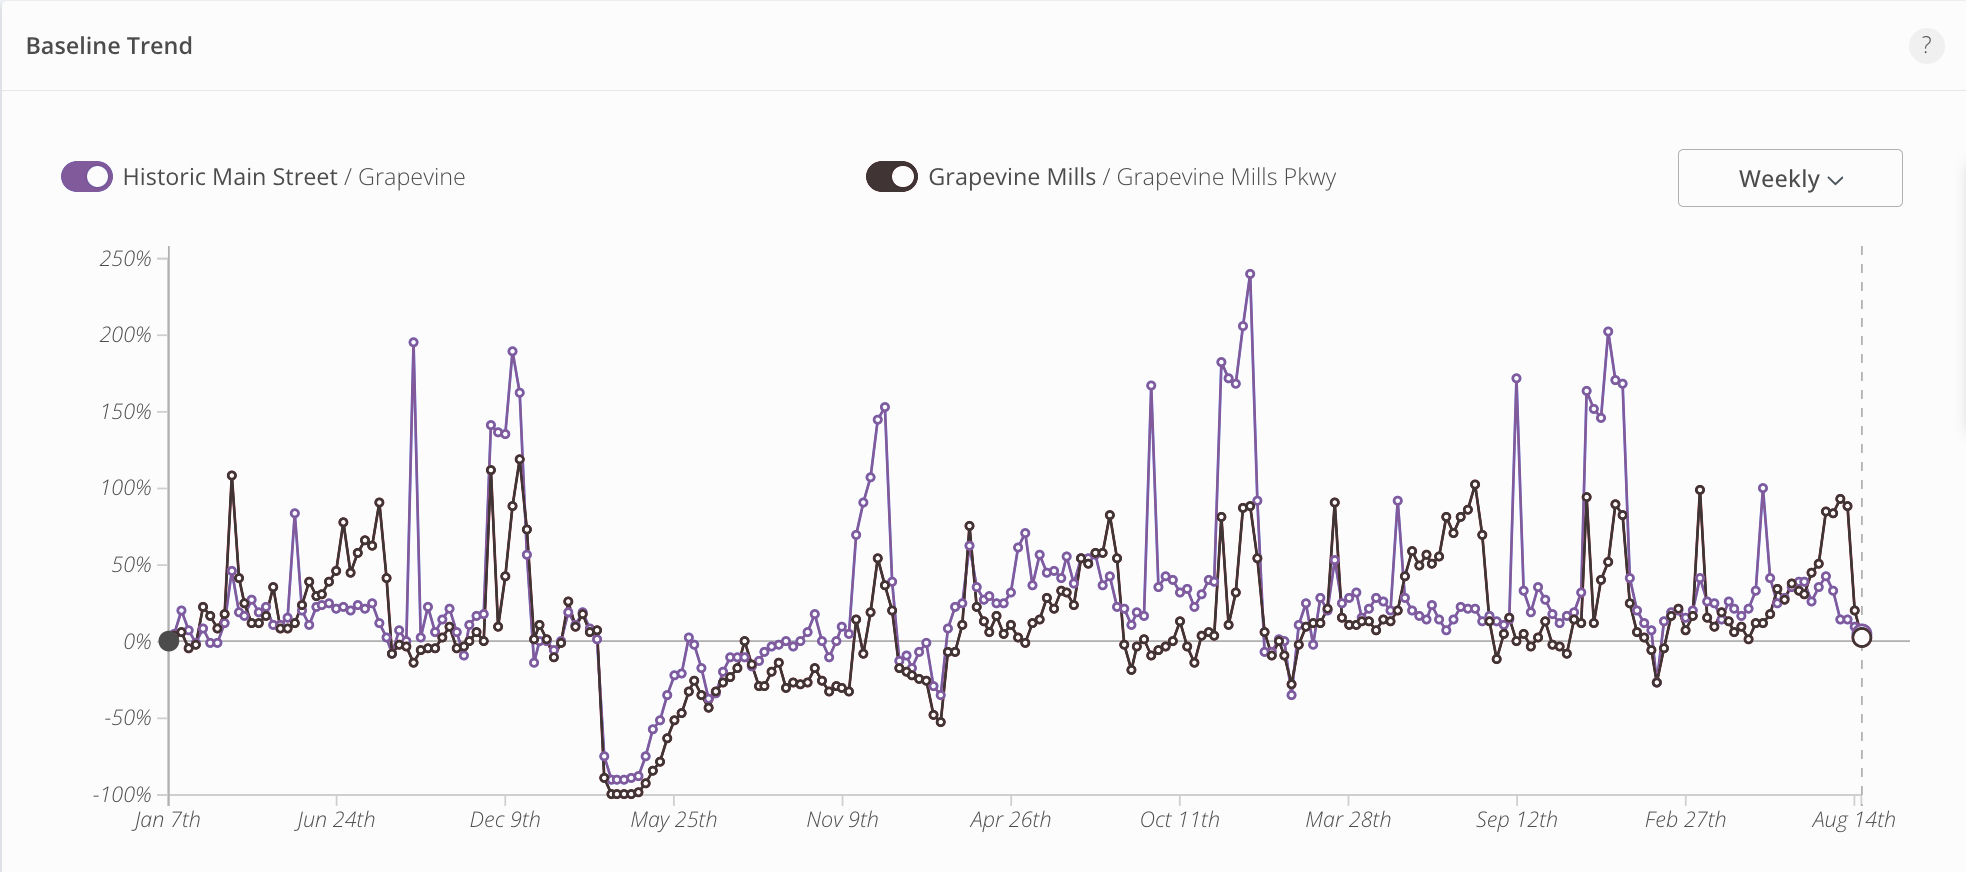
What it is: Foot traffic analysis of both locations showing weekly performance above or below average from January 2019 to August 2023.
What it means: Once again, the pandemic shutdown looms large. Interestingly, when accounting for average performance, Main Street appears to have recovered more quickly than Grapevine Mills. Another notable factor on display here is the relative consistency of performance at the Mills compared to the surging popularity of Main Street. Seasonal spikes account for broader swings in traffic within Grapevine’s Historic District, creating higher highs in visitation compared to more modest months. Meanwhile, shoppers at the Mills come and go in more consistent increments.
Caveat: Those patterns make sense, given the design of the venues themselves. The walkable, outdoor environment within the Historic District would make good weather days stronger on Main Street while the inverse would be true at Grapevine Mills as shoppers and adventurers escape the elements. In addition, outdoor centers generally recovered faster during the pandemic owing to public health guidelines in place at the time.
Chart 3: Visit Share
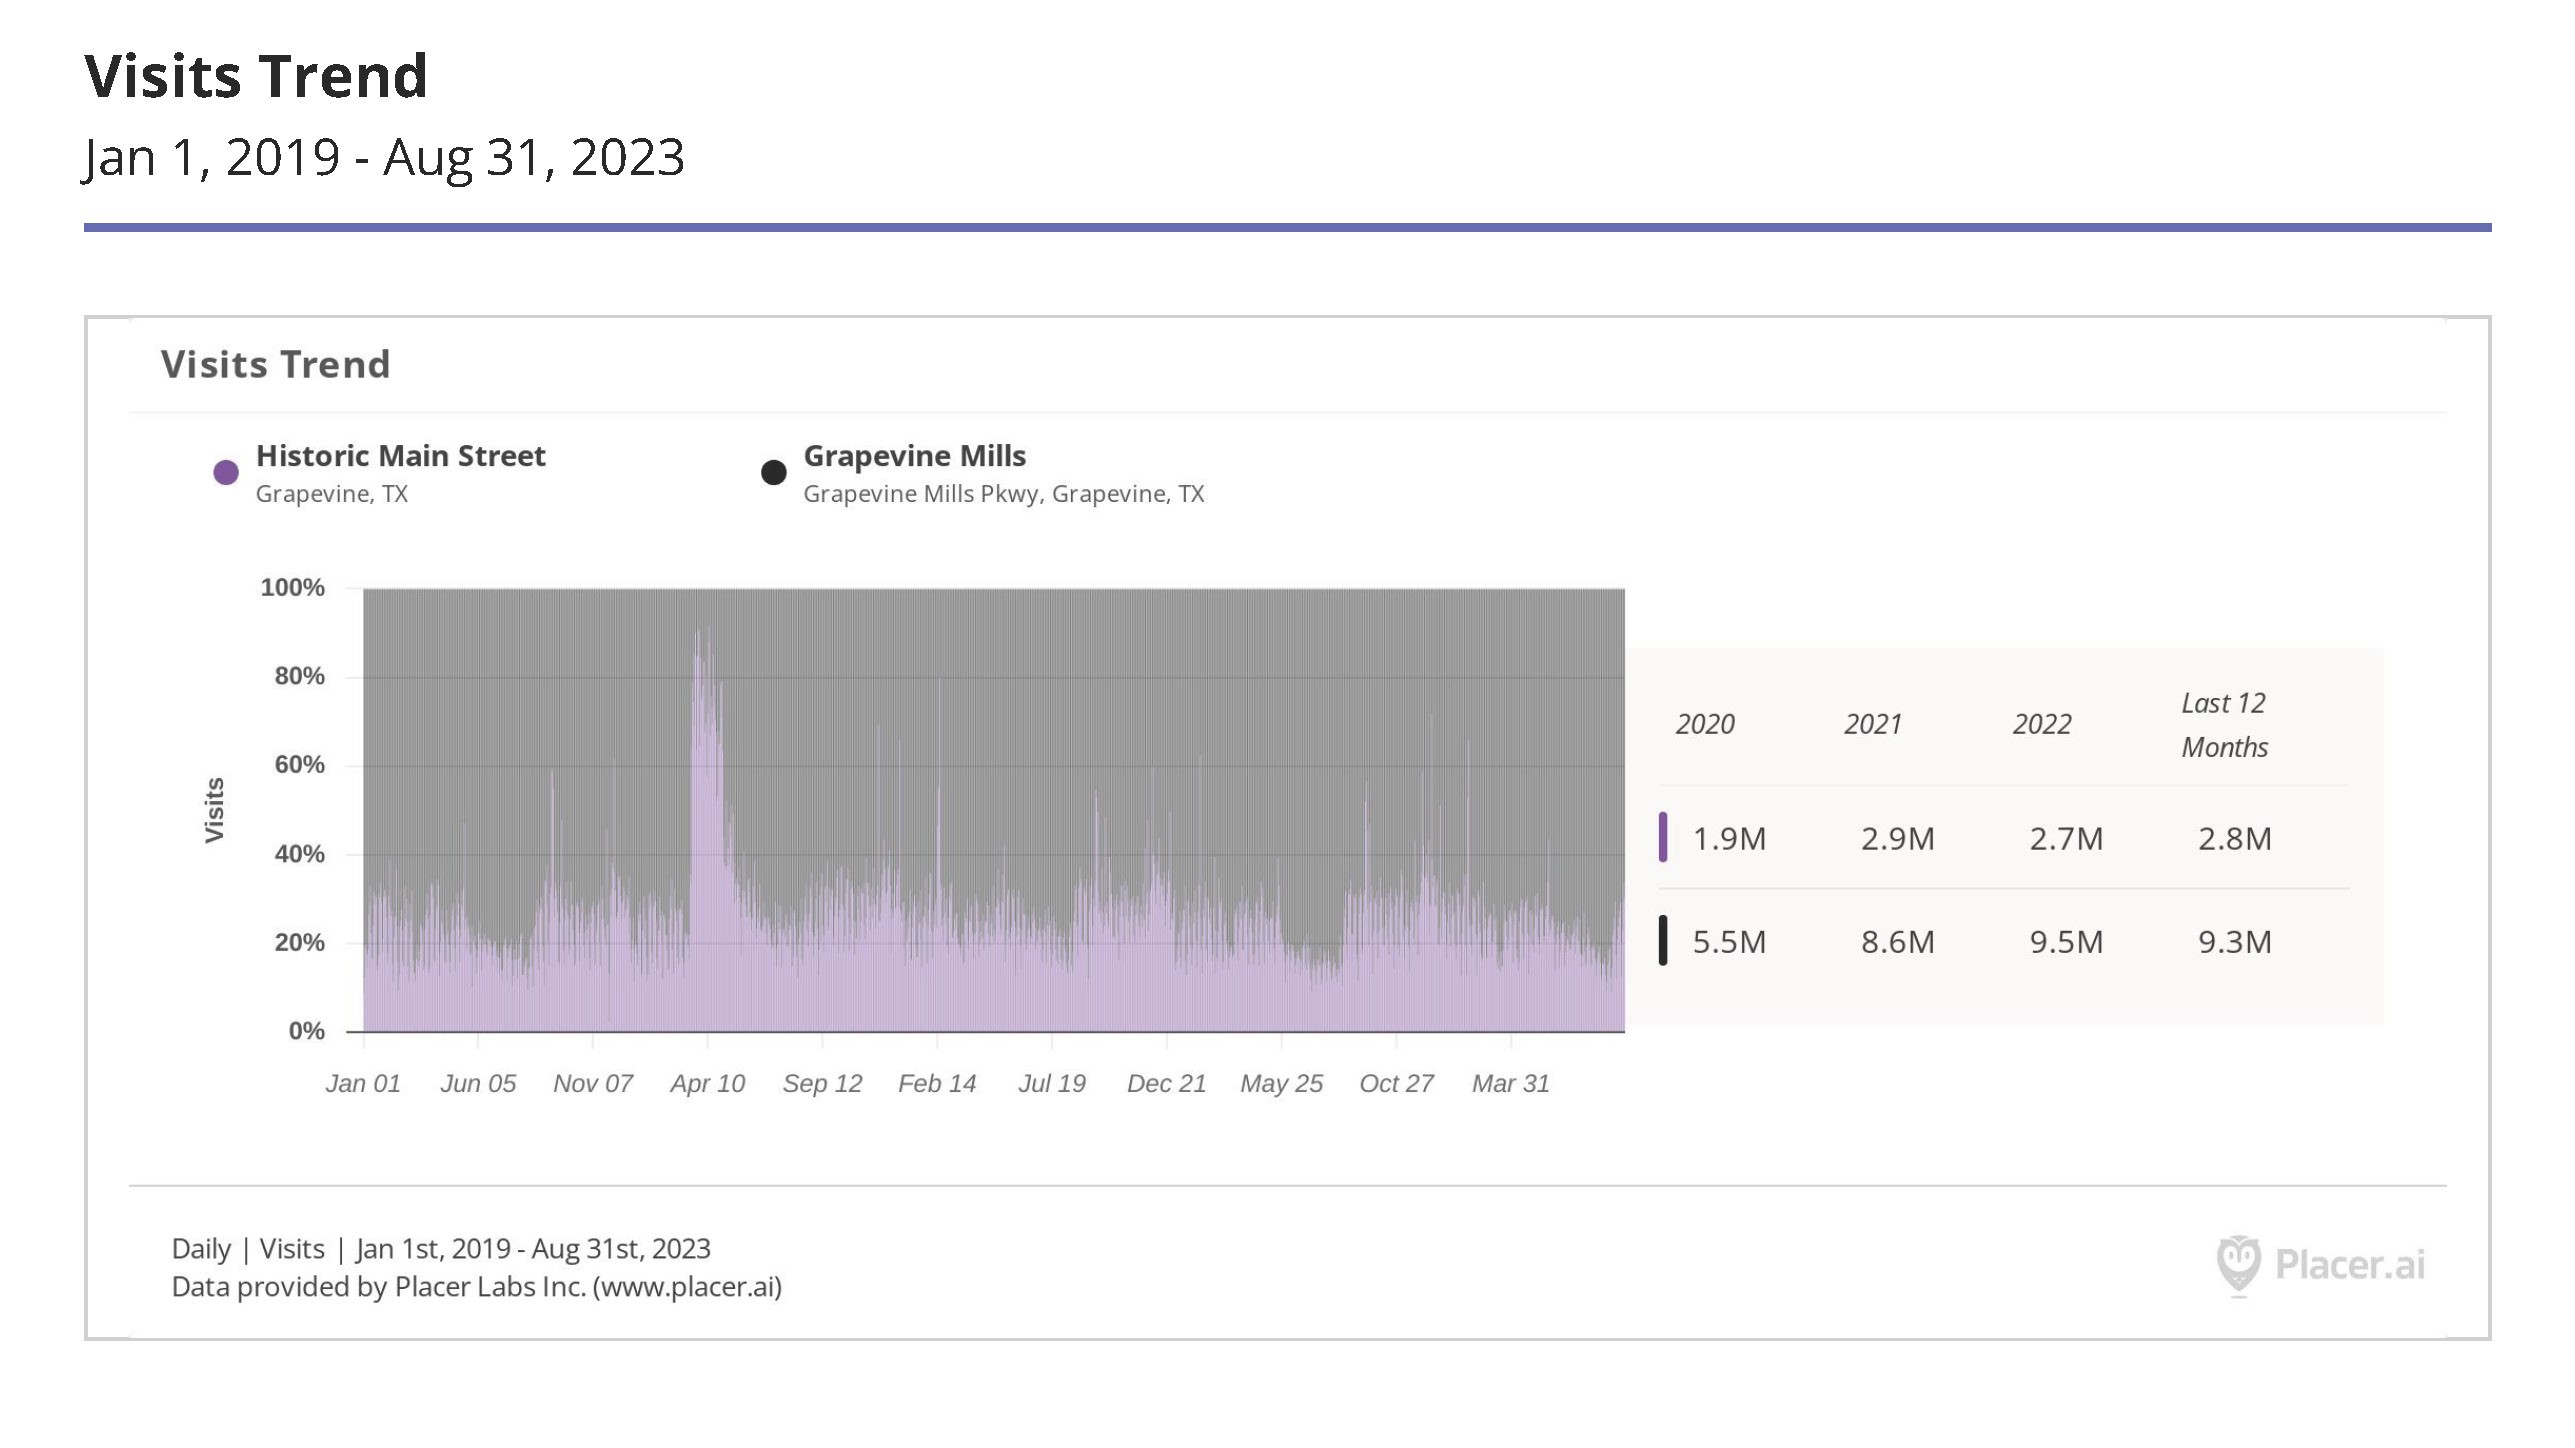
What it is: A day-by-day look at visitation to both sites stacked against each other. The purple section is Main Street, and the black area is Grapevine Mills.
What it means: It’s rare, but Main Street occasionally draws more foot traffic than Grapevine Mills. The trend is so granular that it only emerges on the day-to-day level; there is no week or month in which the Historic District outdraws the 2-million-square-foot-shopping center. But during festivals and events, Main Street punches well above its weight and can draw thousands more visits than the Mills.
Caveat: That big, purple spike in the Spring of 2020 is a misnomer – Grapevine Mills would have been closed completely due to COVID restrictions, while Main Street remained open to the public even if stores were not. But other dates of significant visit share for Main Street line up with events such as Carol of Lights, GrapeFest, and the September 11 memorial.
Charts 4 & 5 – High Traffic Times
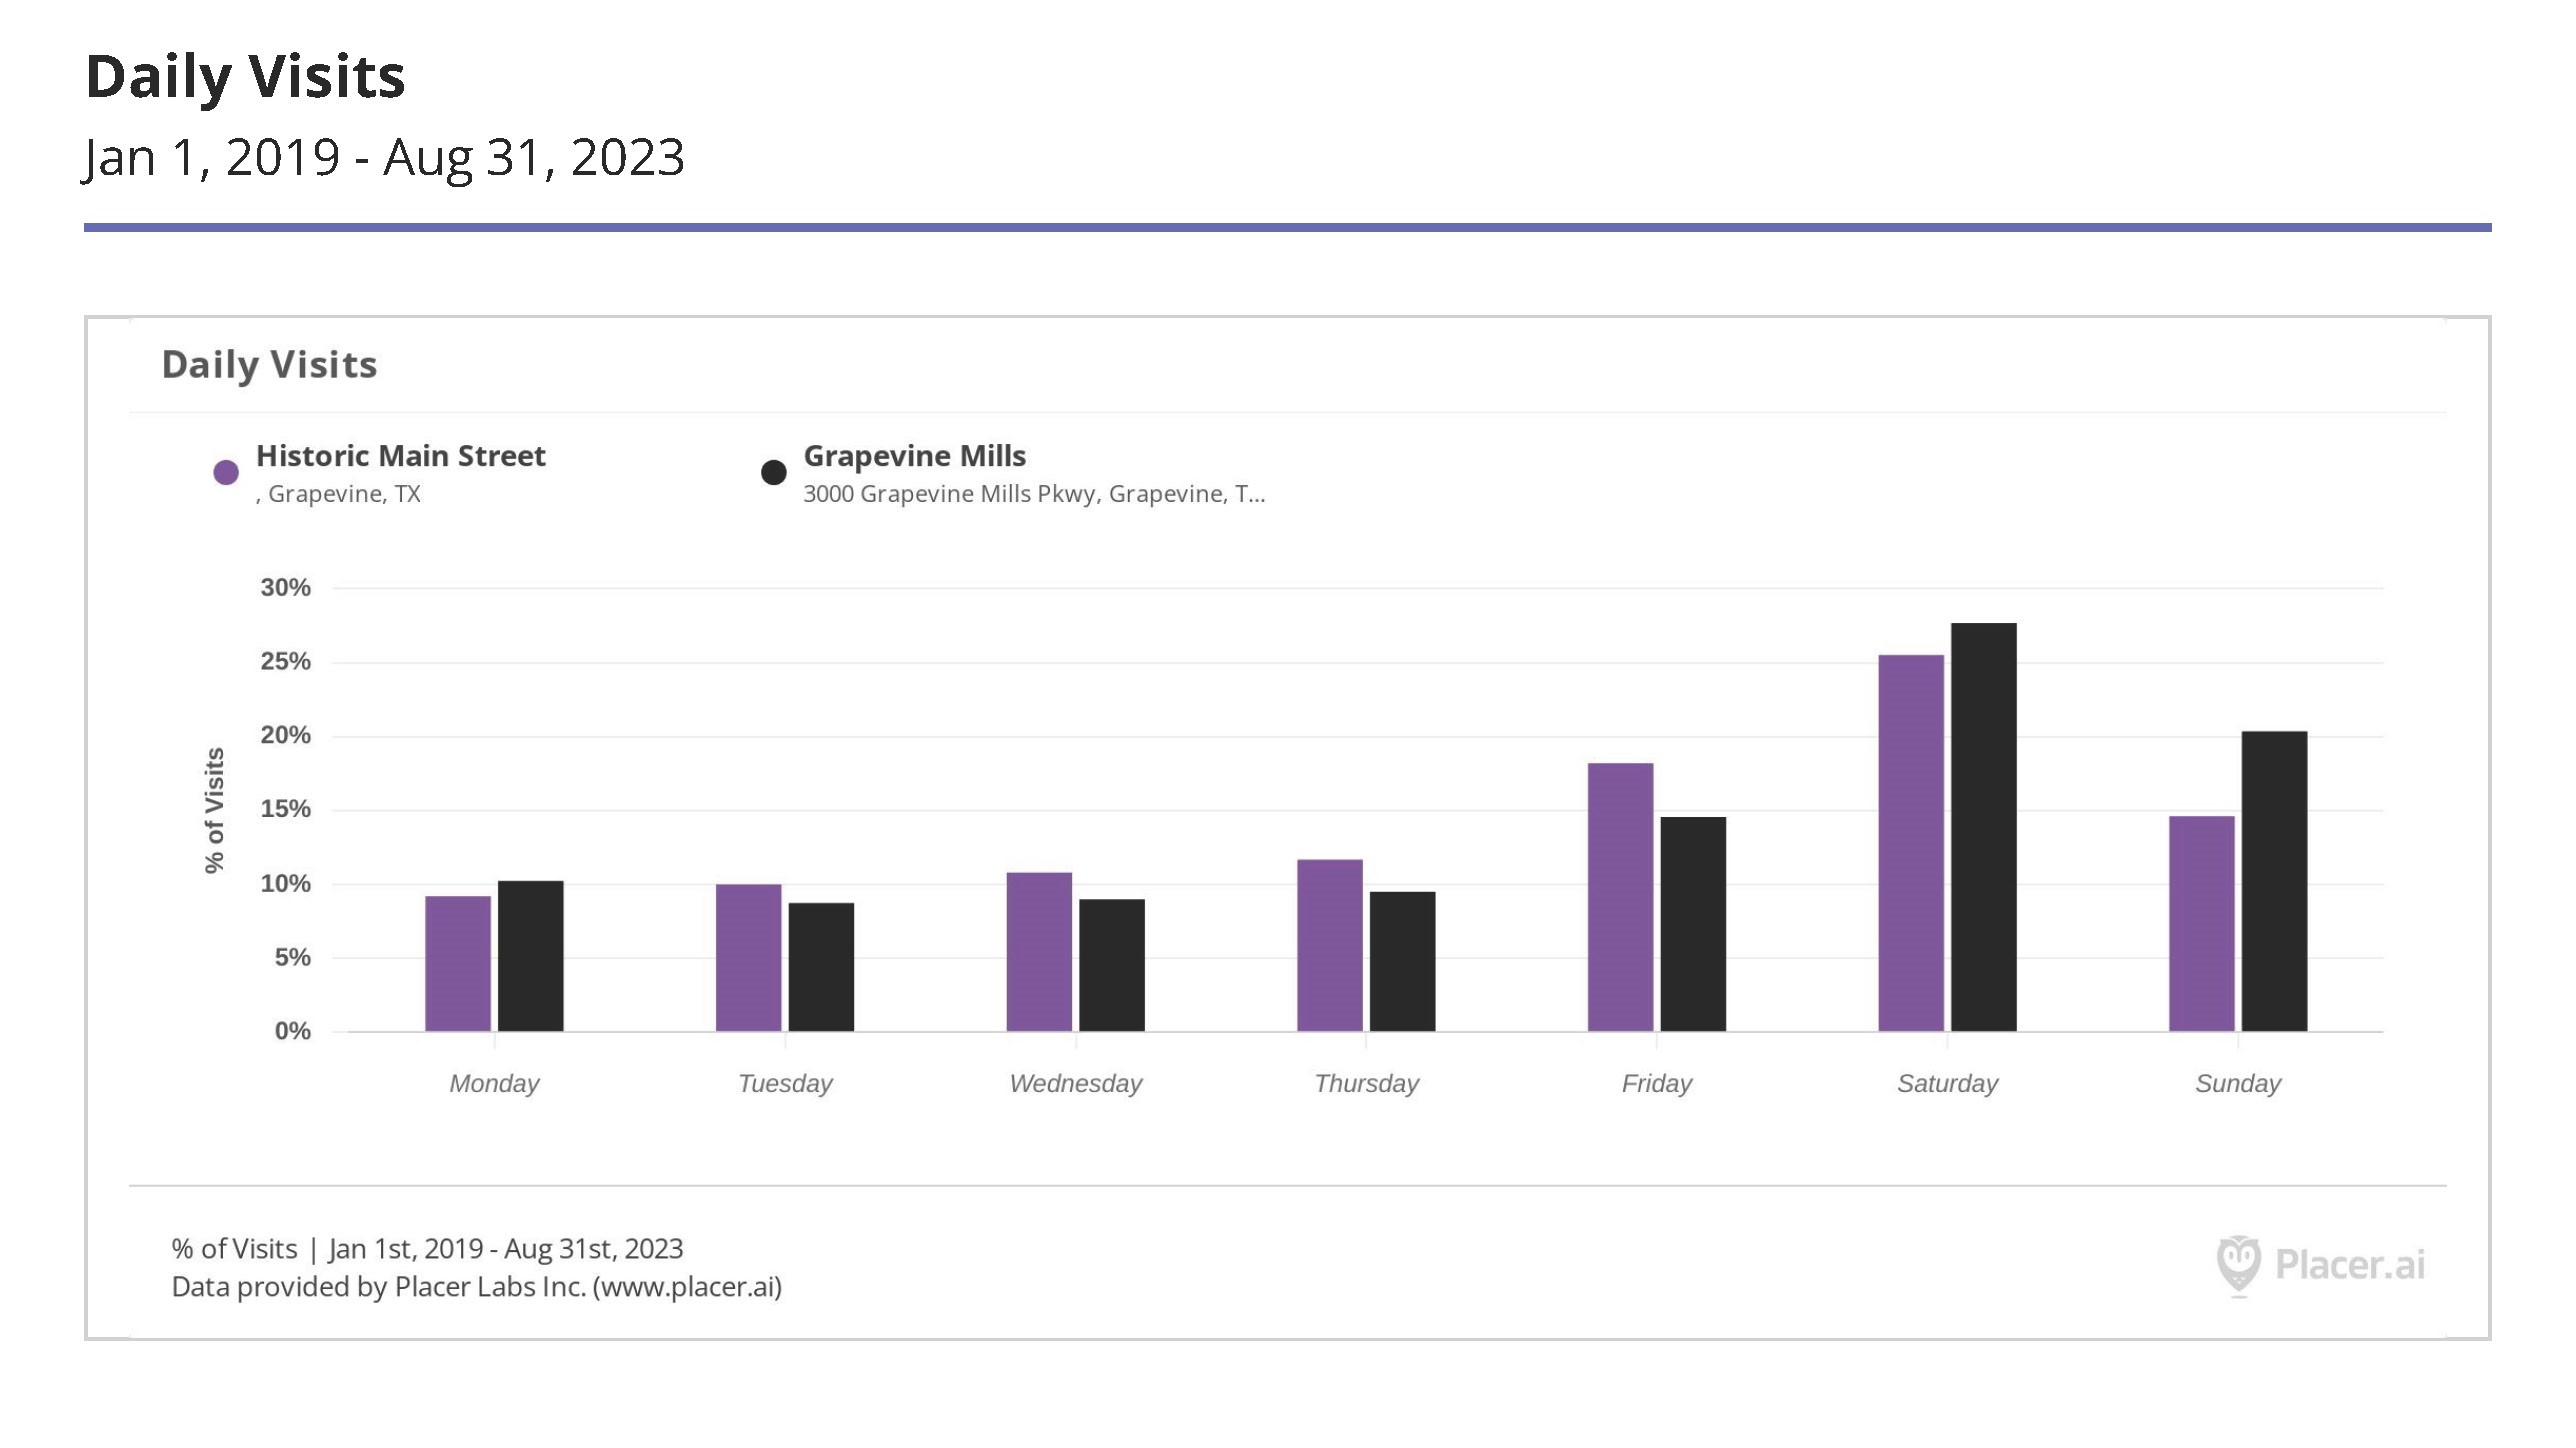
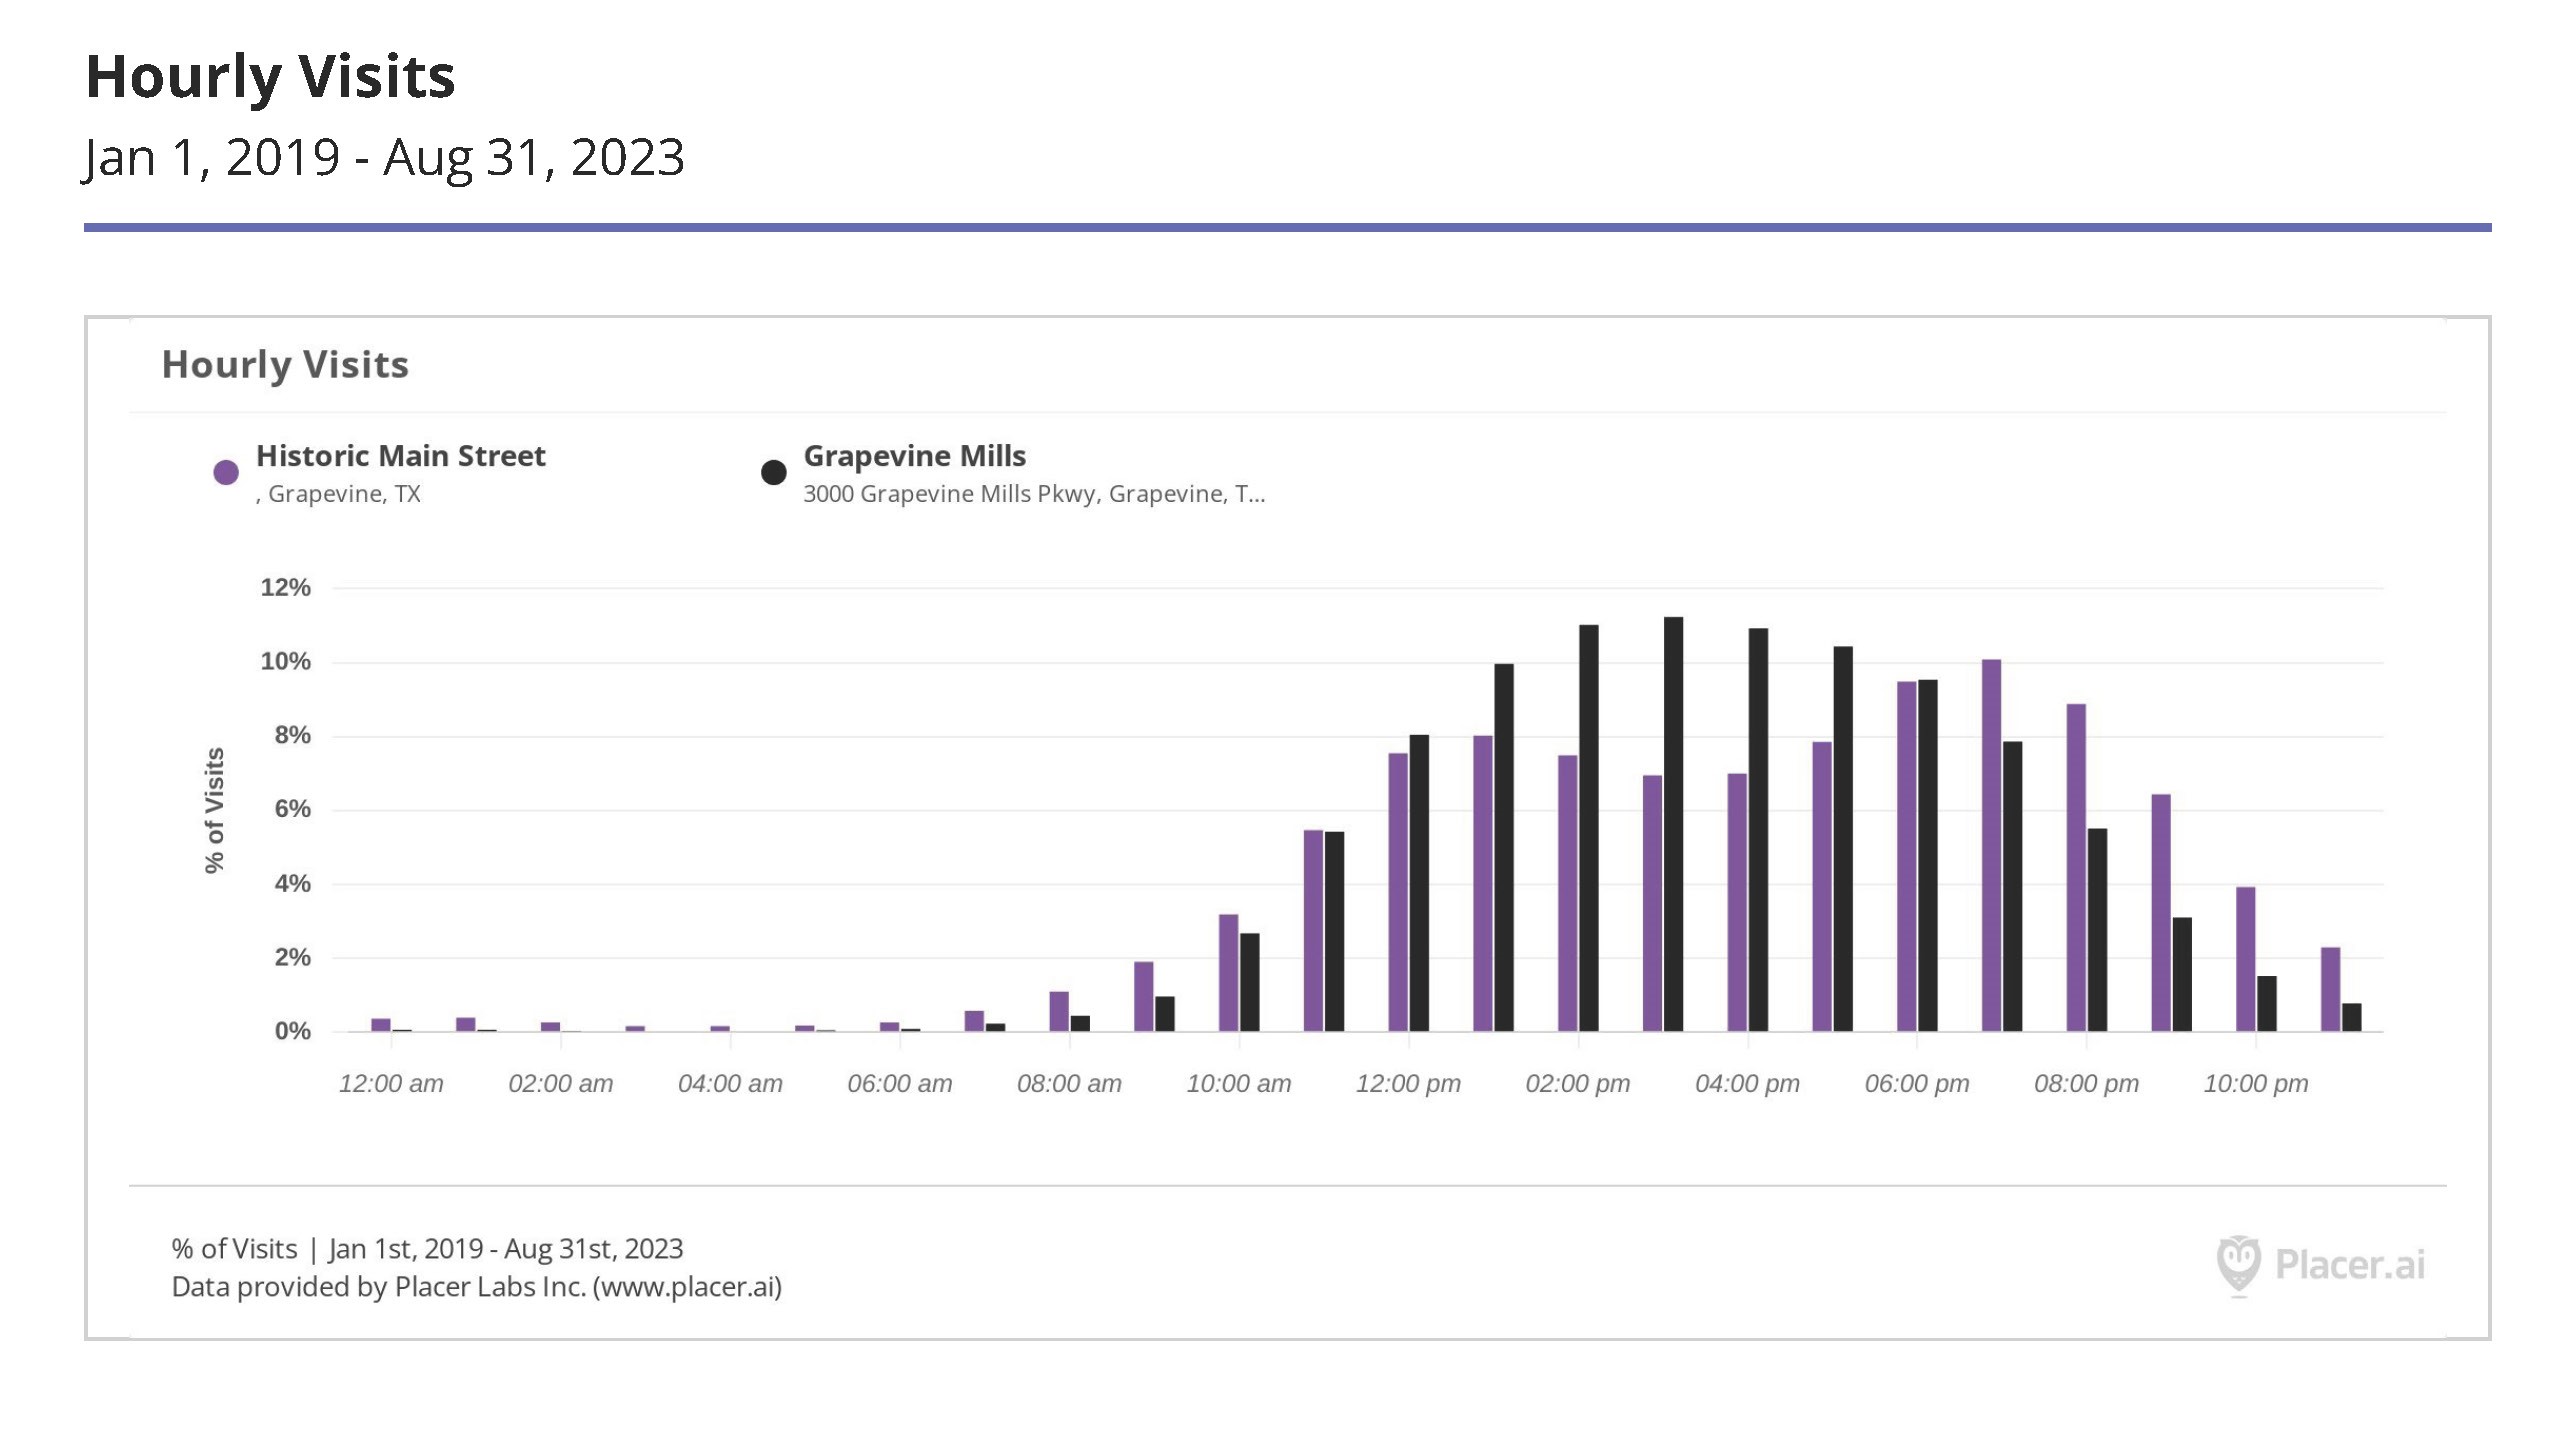
What it is: Side-by-side comparisons of the most popular days of the week and hours of the day for each location, listed as a percentage of total visits estimated during the five-year window examined.
What it means: No matter how you slice it, weekends and late afternoons/early evenings are big in Grapevine. Audiences tend to favor Grapevine Mills for full-day itineraries, choosing Saturday and Sunday overwhelmingly and generally hanging out between lunch and dinner. Main Street is more popular for short trips, with visitors favoring Friday and Saturday evenings. Not included in these charts: the average dwell time – total length of each visit in minutes – at both locations, each of which sits just under two hours (117 minutes on Main Street and 102 minutes at the Mills).
Caveat: These charts had to be given as percentage values rather than visit totals because the number of visits to Grapevine Mills is so large as to skew the chart beyond legibility. While the actual drawing power of each site is different, it’s certainly interesting that they both do at least a quarter of their business on Saturdays alone.
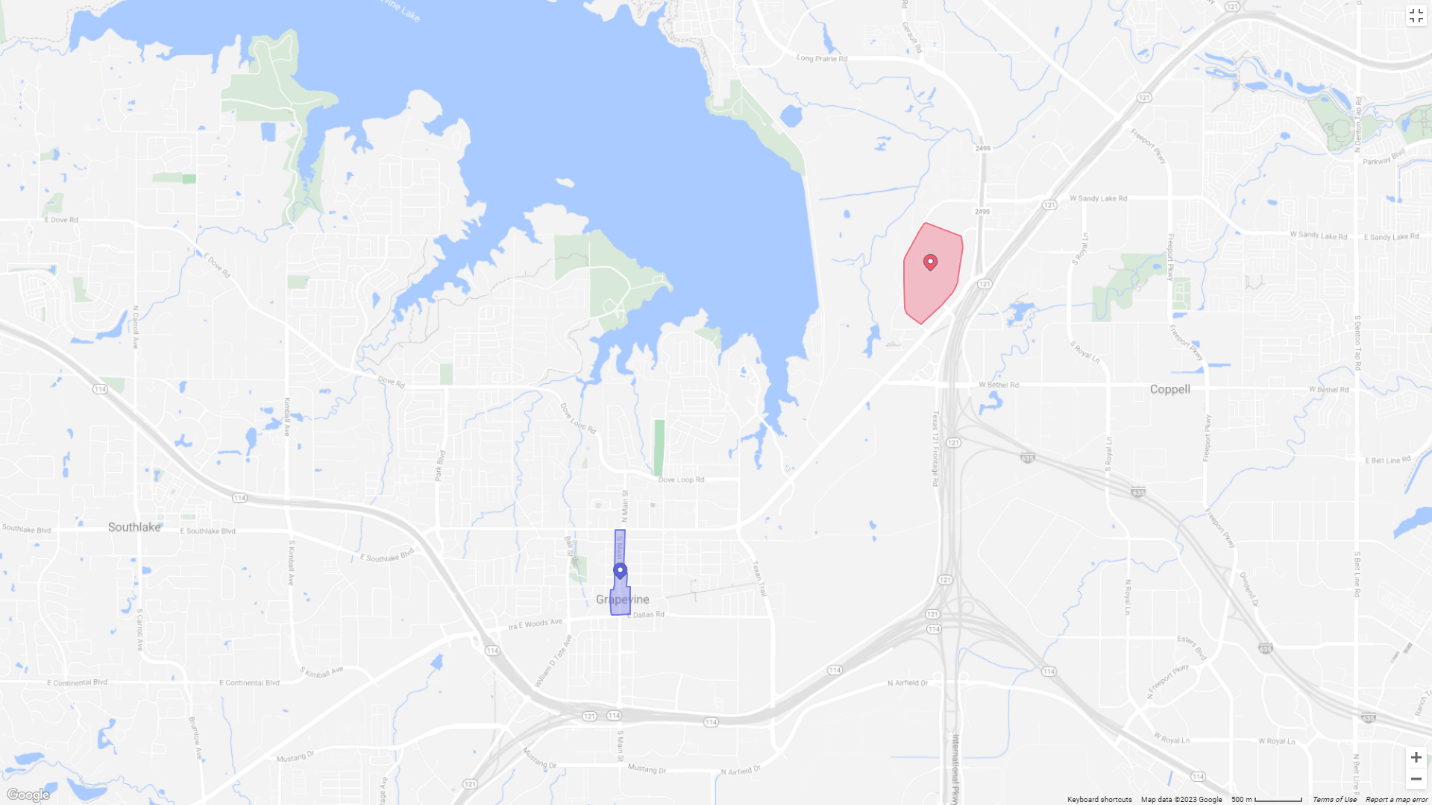
Chart 6 – Trade Area Footprints
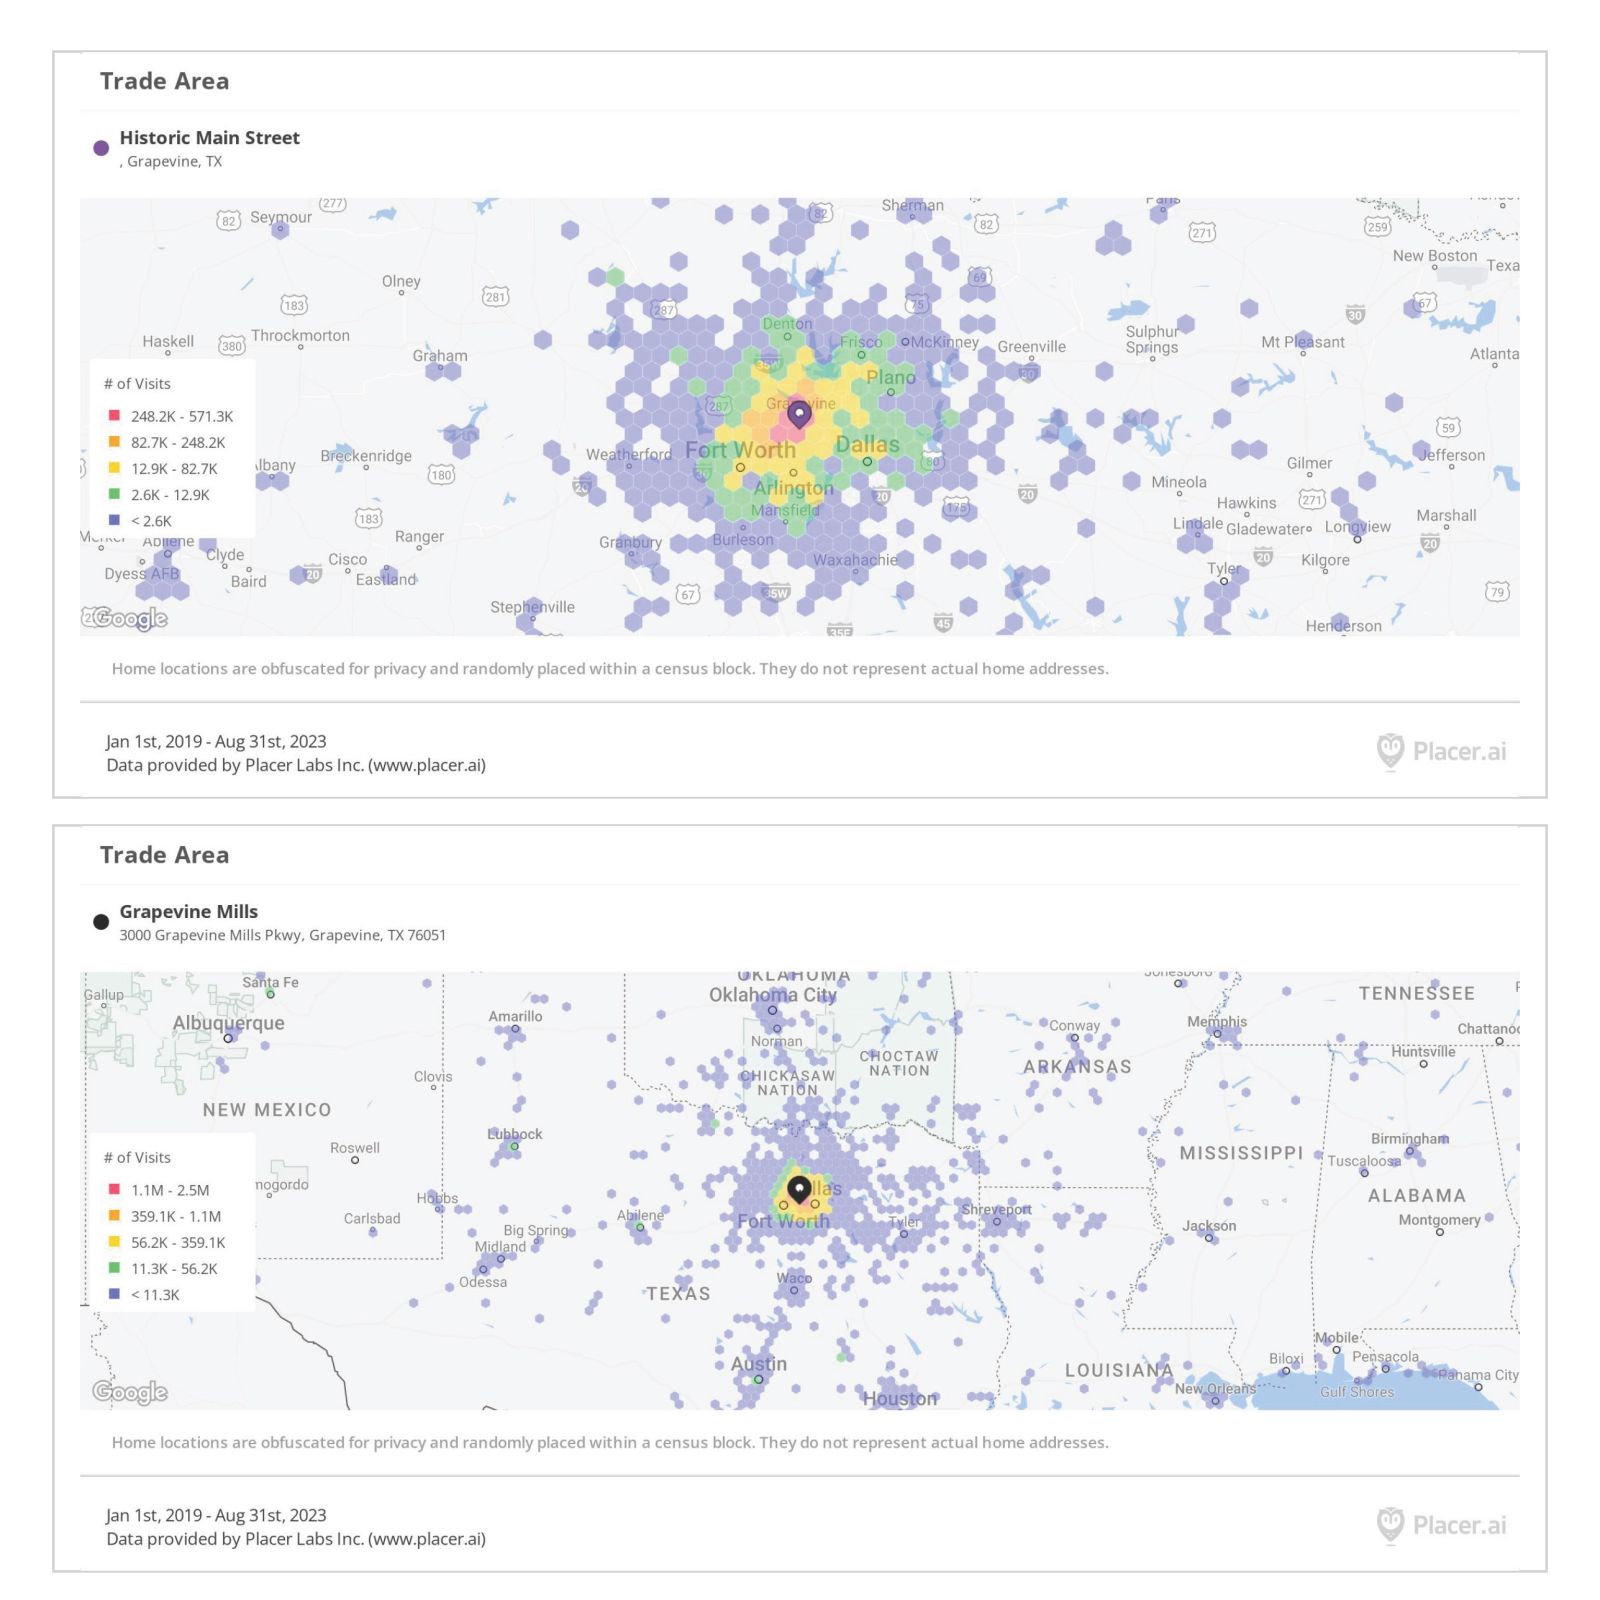
What it is: Generalized data on the origins of people who visited Grapevine at least once in the last five years, mapped. The top image is the trade area for Main Street; the bottom represents the trade area for Grapevine Mills.
What it means: Both centers pull in shoppers from far and wide, but Grapevine Mills has an undeniable regional influence. Main Street is incredibly popular within a 10-15 minute drive radius while also benefitting from local hotels and tourism. More on that in Charts 9 and 12.
Caveat: A glance at the map keys will reveal that these snapshots aren’t sufficient to tell the whole story, since comparing Main Street and the Mills isn’t exactly apples-to-apples. We chose to zoom out further on one map to illustrate that point, but it should be noted that Main Street, too, draws visitors from Shreveport, Oklahoma City, and plenty of other out-of-state markets.
Chart 7 – Visitor Journey Distance
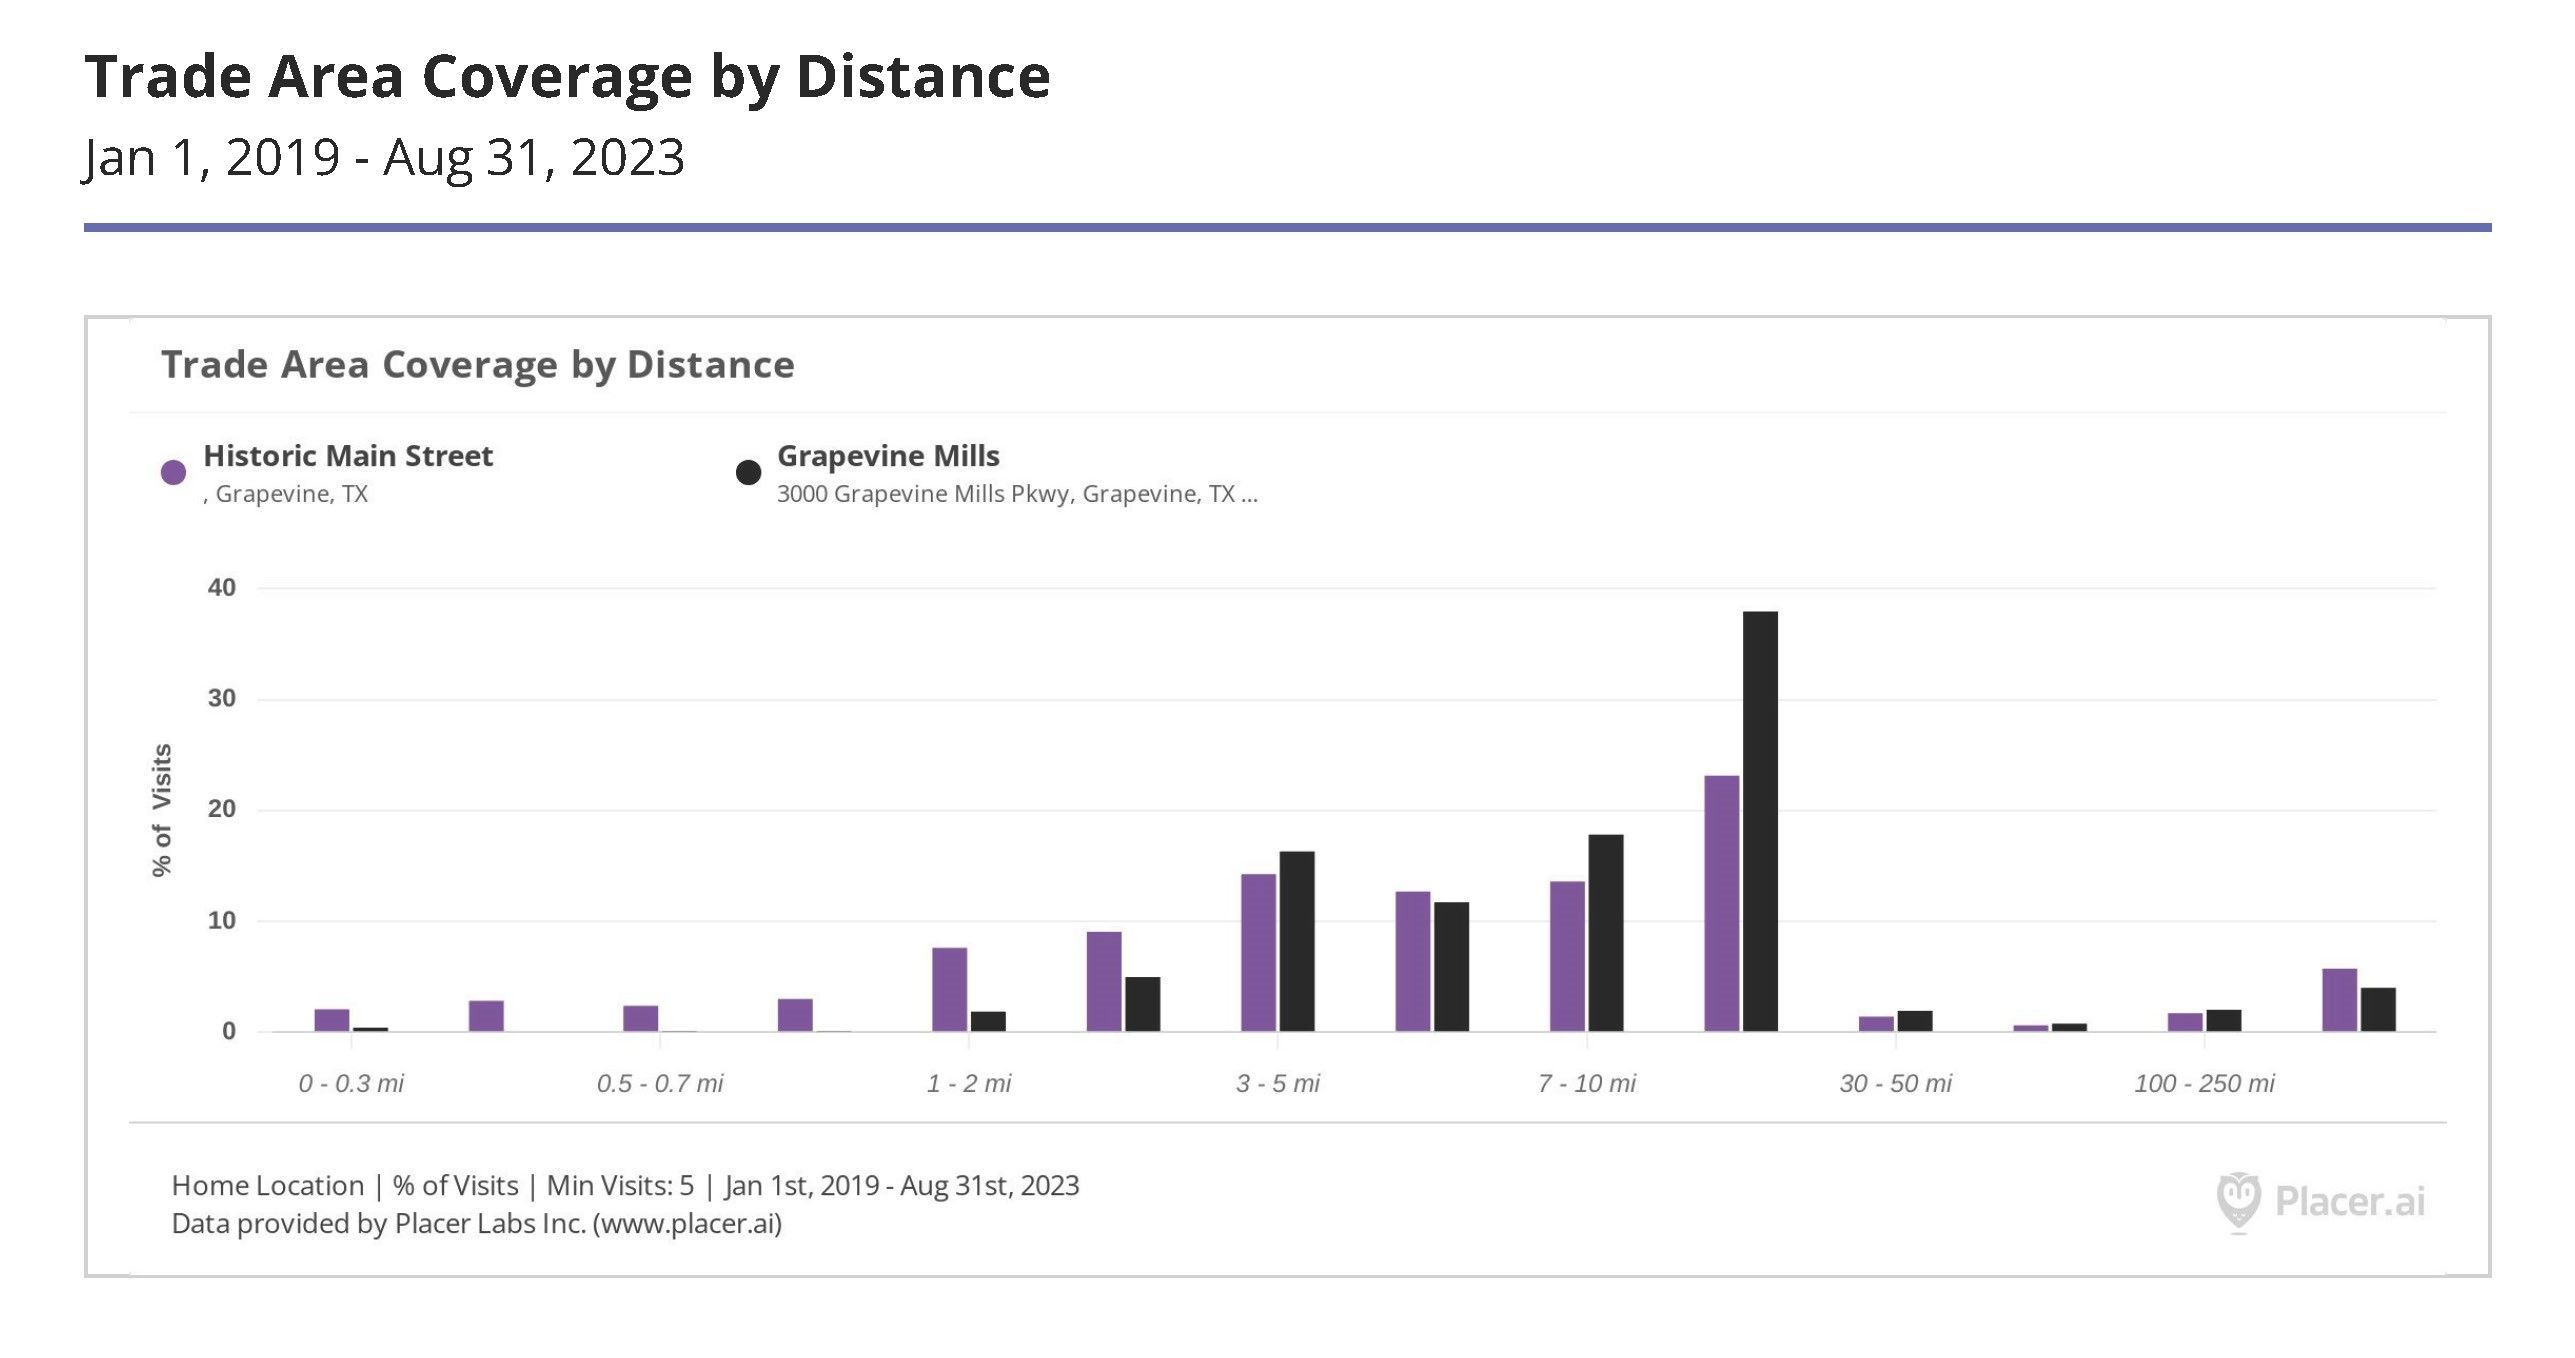
What it is: A percentage breakdown of the most common distances traveled by visitors to both sites during the period in question. A minimum of five visits (roughly one per year) was applied to these data.
What it means: It’s much easier to walk to Main Street than the Mills, but (as shown in Chart 6) folks are willing to come a long way to visit both sites. The 10-30 mile segment is particularly popular, providing 23% of all visits to Main Street and 38% of traffic at Grapevine Mills. Statistically speaking, people you encounter in either location are more likely than not to have traveled at least 5 miles to be there. Roughly one in ten will have logged over 30 miles.
Caveat: Placer has to do a lot of extrapolating once you leave the United States, so it’s likely that international travelers are under-represented here. Staff at both the Grapevine Convention and Visitor’s Bureau and Simon Property Group (which owns Grapevine Mills) have listed markets such as China, Australia, and Mexico as major contributors to international travel interest in Grapevine.
Chart 8 – Visitor Journey by Origin and Destination
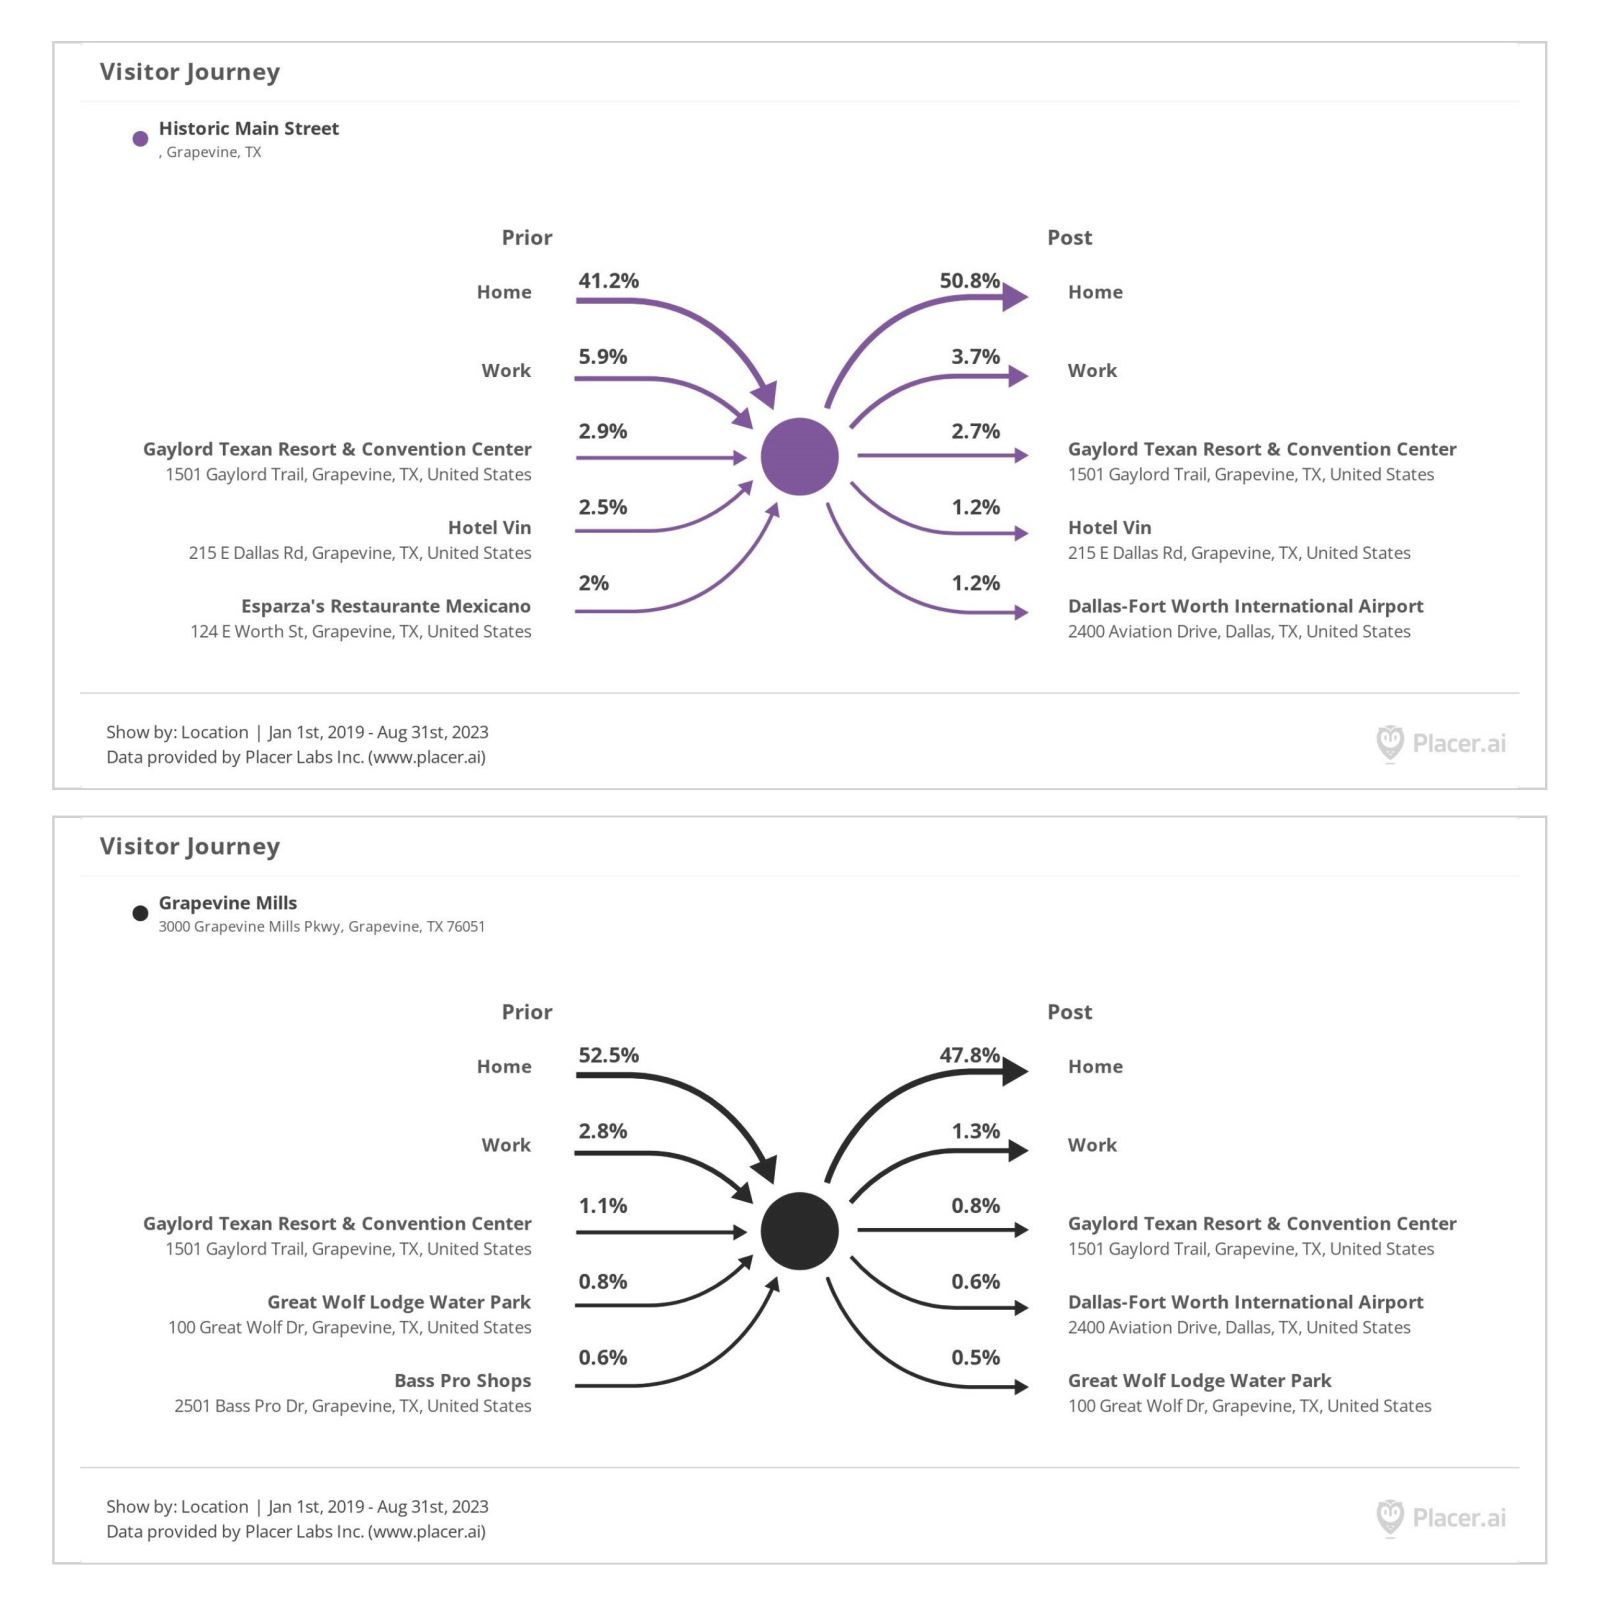
What it is: A side-by-side comparison of the most common starting points for a journey to each location from January 2019 until the end of August 2023.
What it means: Major hotels undeniably feed both Main Street and Grapevine Mills. It’s common for the top two points of origin to be Home and Work, respectively… the next three options in each list are the most intriguing. One in twenty Main Street shoppers come directly from either the Gaylord or Hotel Vin. Great Wolf Lodge falls just shy of landing the next slot down on the Main Street chart, sitting behind Esparza’s – just off Main Street – and DFW International Airport but still contributing about 1 out of every 100 visits to the Historic District. Both the Mills and Main Street appear to be a popular final activity before travelers return home via DFW, but Grapevine Mills benefits disproportionately from destination shoppers looking for specialized inventory at Bass Pro Shops across the street.
Caveat: With as many varied attractions and potential jump-off points as Grapevine presents, it makes sense that no single destination has an outsized share of the visitor journey to either economic center. All kinds of venues generate a portion of a percentage point of traffic to both Main Street and the Mills, from hotels to fast food vendors. For this chart, even a 1% stake is notable.
Chart 9 – Zip Code Dominance
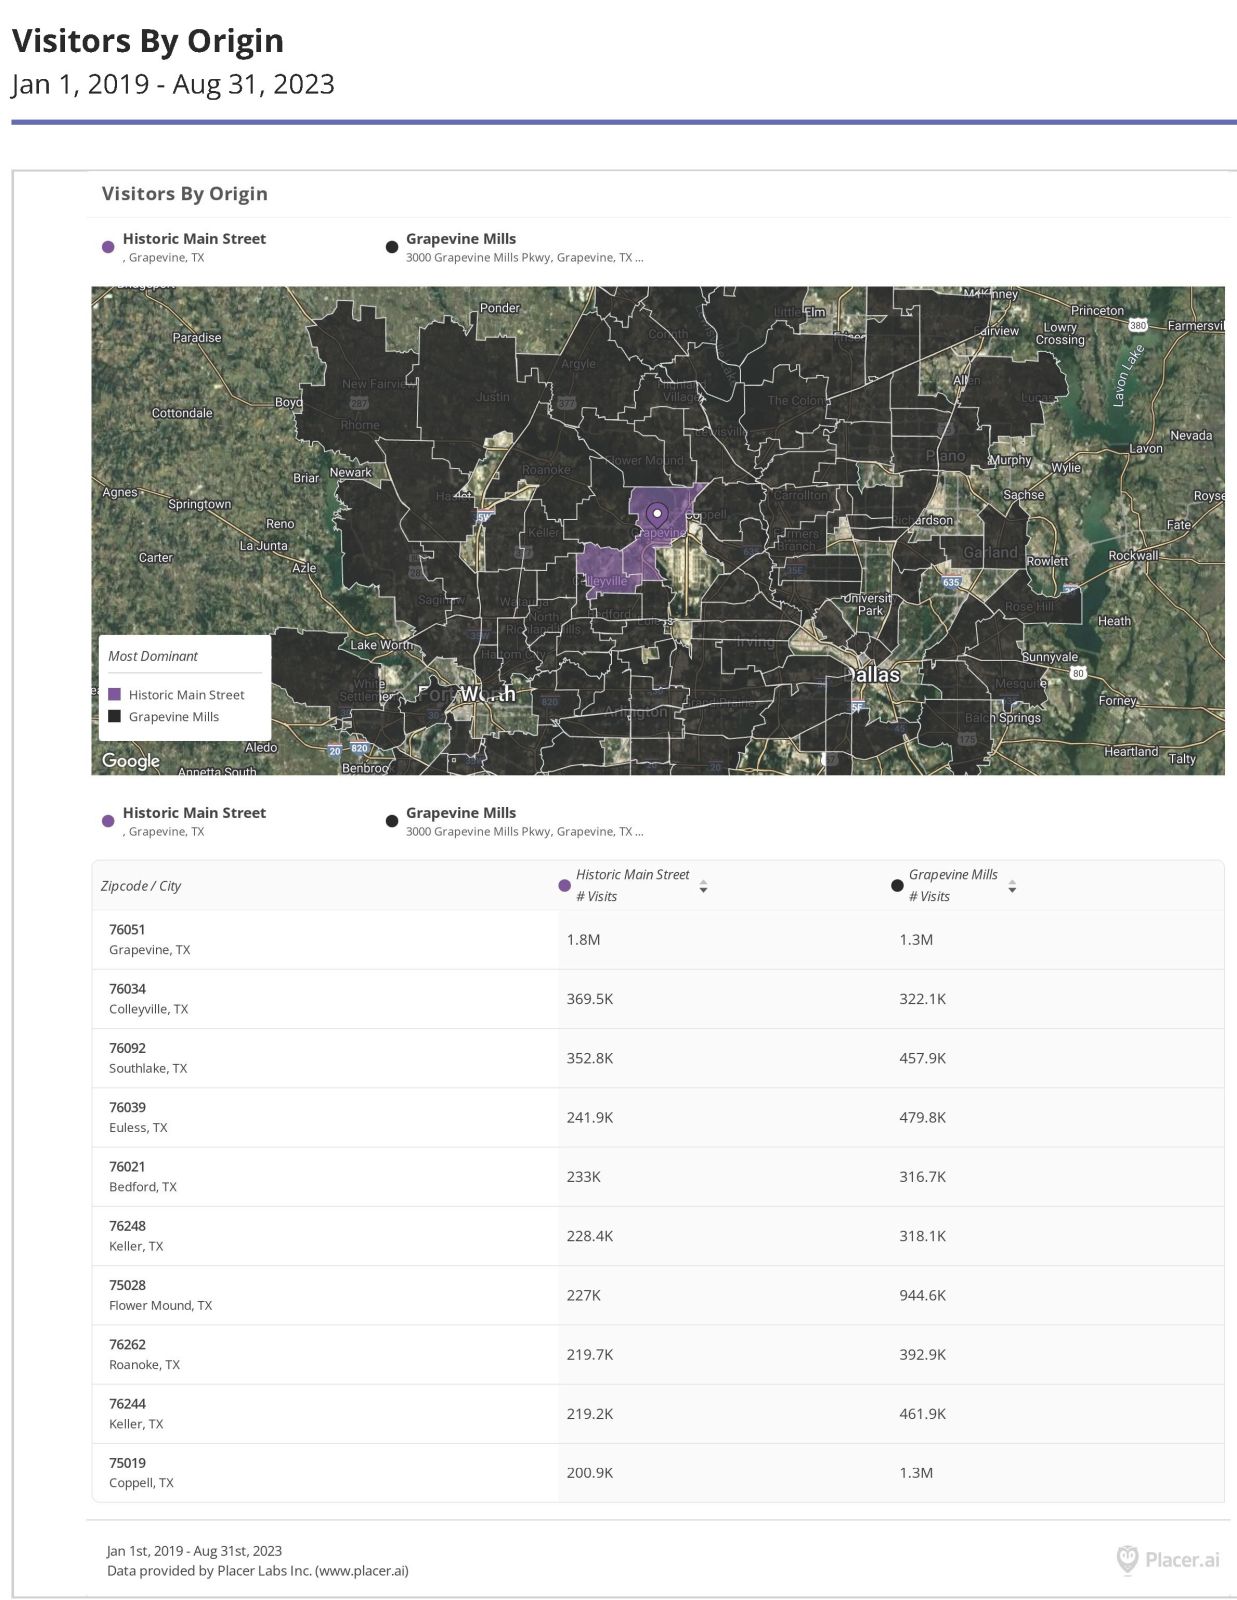
What it is: A list of the top ten zip codes represented in visitor estimates for both sites between January 2019 and August 2023, ranked by total contribution and color-coded by dominance.
What it means: The broader drawing power of Grapevine Mills makes it more popular around DFW than Main Street in terms of total foot traffic, but locals clearly love Main Street. The fact that such a small area could outdraw a sprawling retail hub in multiple zip codes is a testament to the reputation of the Historic District: Colleyville and Grapevine residents prefer Main Street, but folks as far as Keller, Roanoke, and Coppell can’t resist the deals and delights of Grapevine Mills.
Caveat: Obviously, the full list of zip codes served by both centers is quite lengthy. We limited the chart to the top 10 for the sake of brevity, but the map gives a sense of just how many communities know and love Grapevine.
Chart 10 – Fans and Super Fans
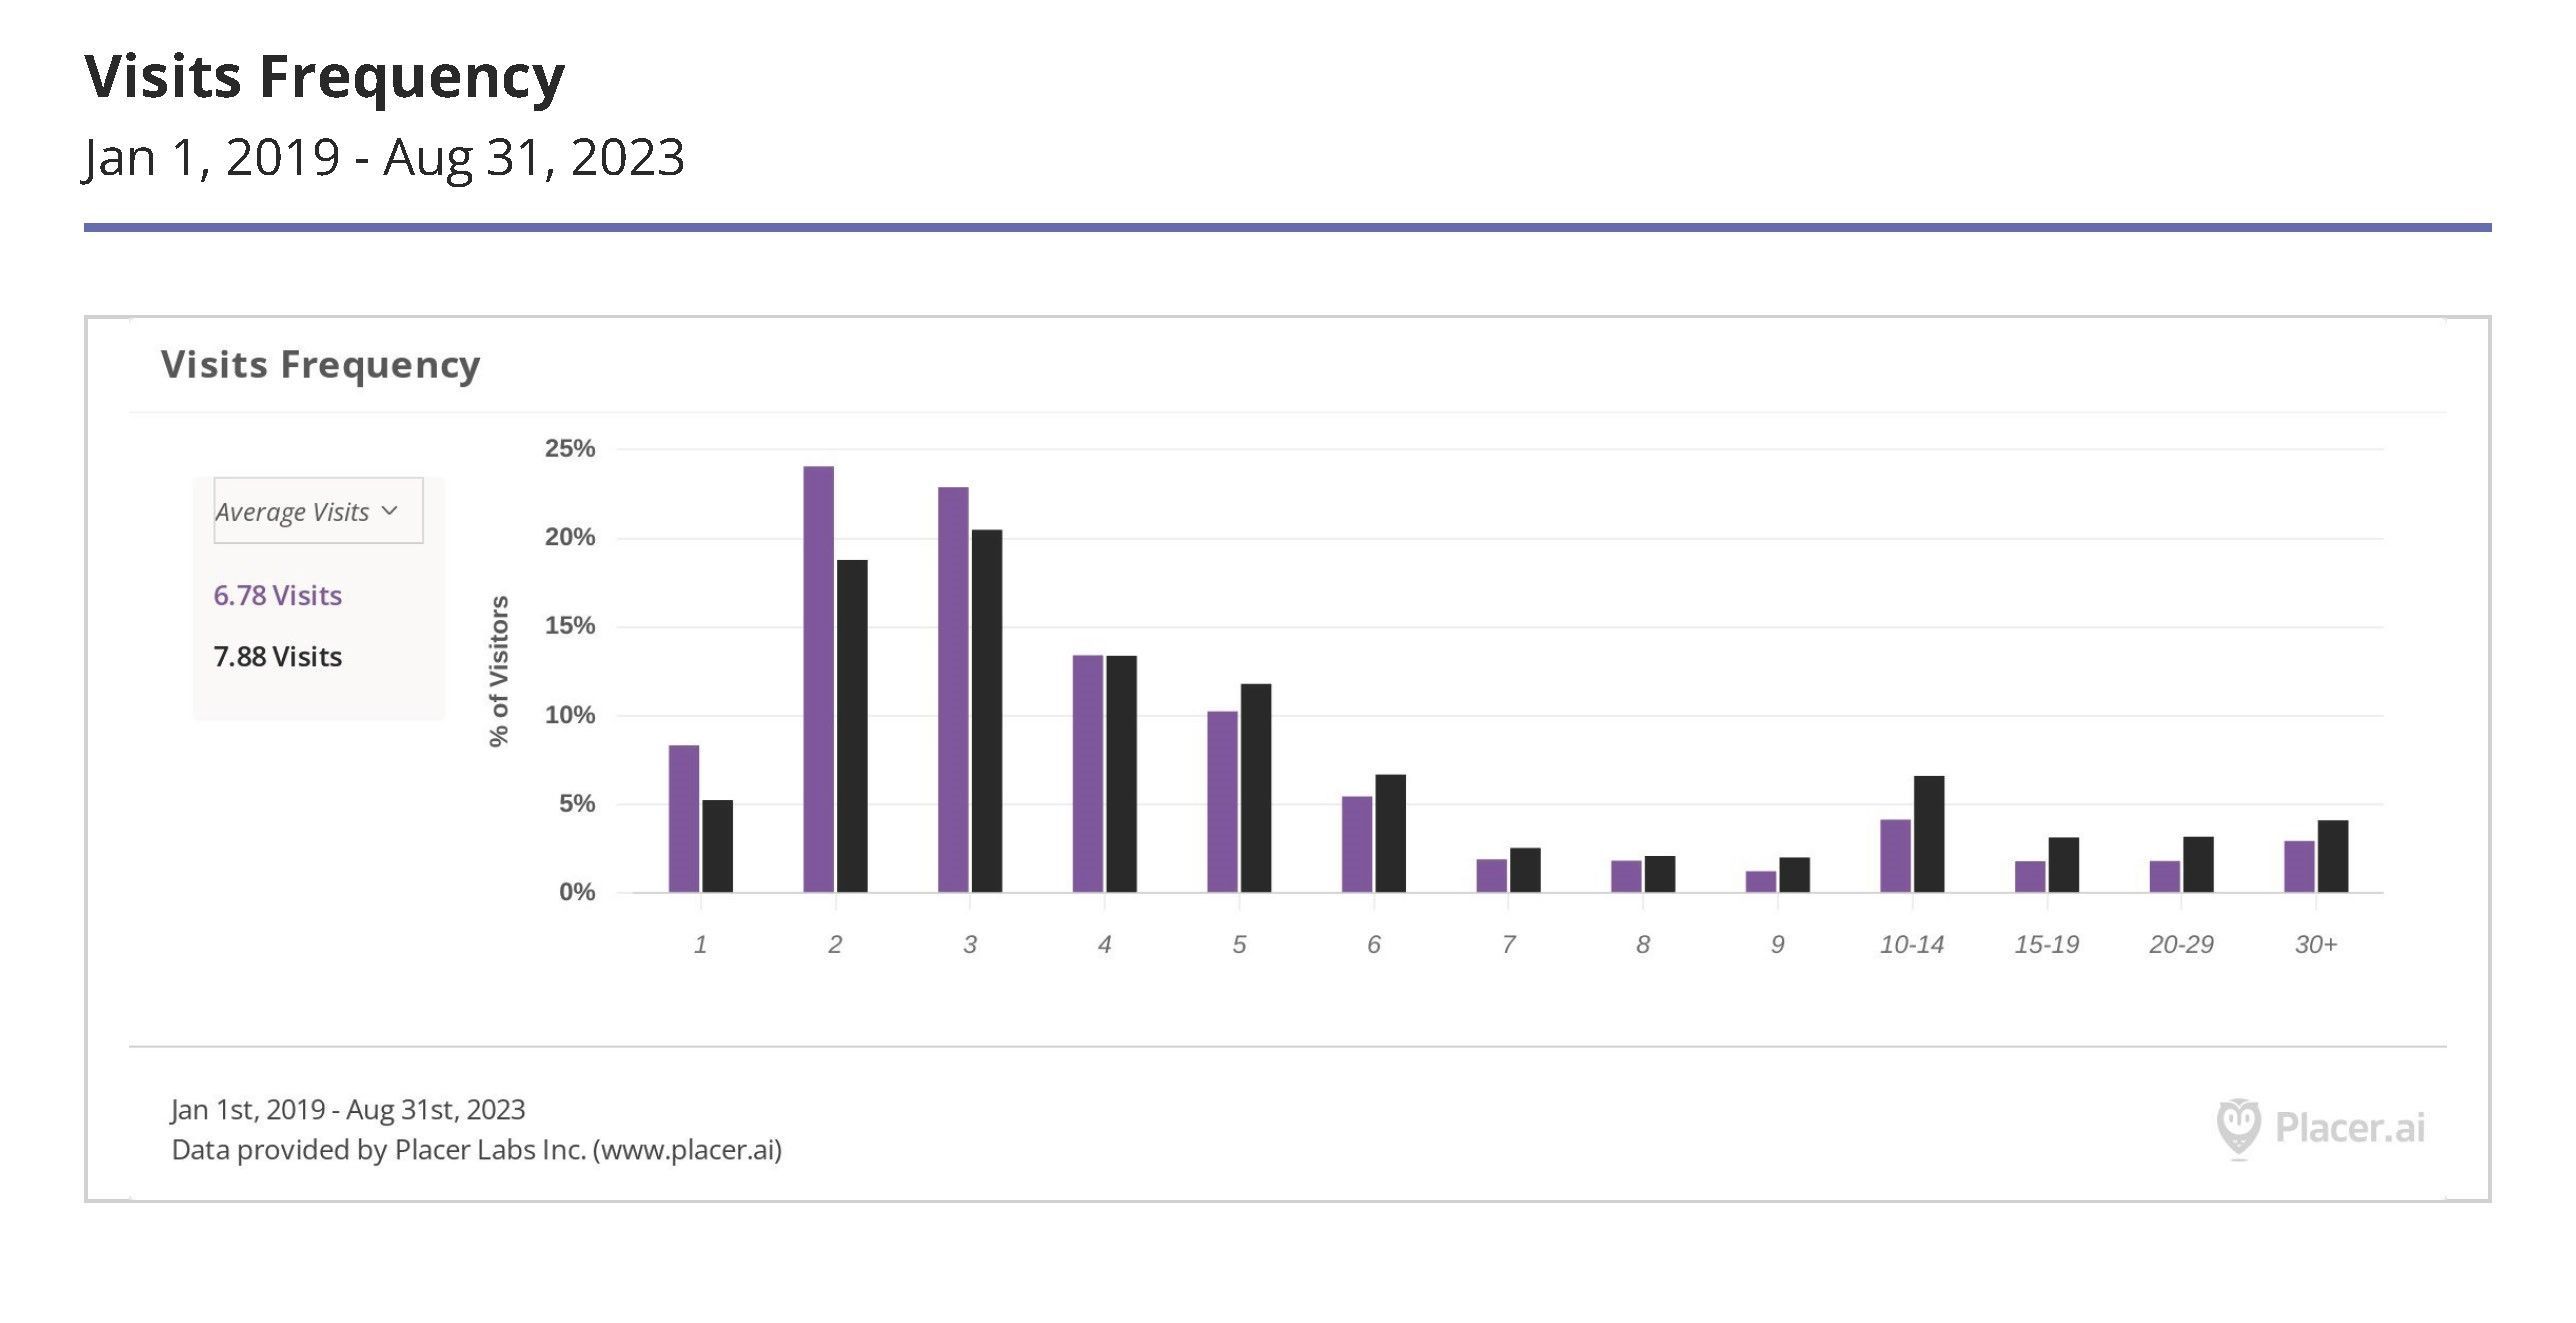
What it is: A breakdown of visitation habits at each center since January 2019, distributed by frequency of visit and charted as a percentage of the whole.
What it means: Generally, people in DFW come to Grapevine at least once a year. This survey spans a little over 4.5 years, during which time the average visitor walked Main Street almost seven times. The total was almost a full trip higher at Grapevine Mills, and both places had “regulars” who popped in at least once a quarter: 5% of Main Street shoppers and 7% of Mills shoppers visited 20 or more times.
Caveat: With timespans this long, the math can get fuzzy. Statistically, a person who purchased and returned items at Grapevine Mills multiple times in one month but never returned after that would look the same as someone who showed up exclusively for every Black Friday event during this time span. The averages presented in the paragraph above are theoretical; meant to help you understand the data rather than stake a specific claim.
Chart 11 – Visitor Spending Power
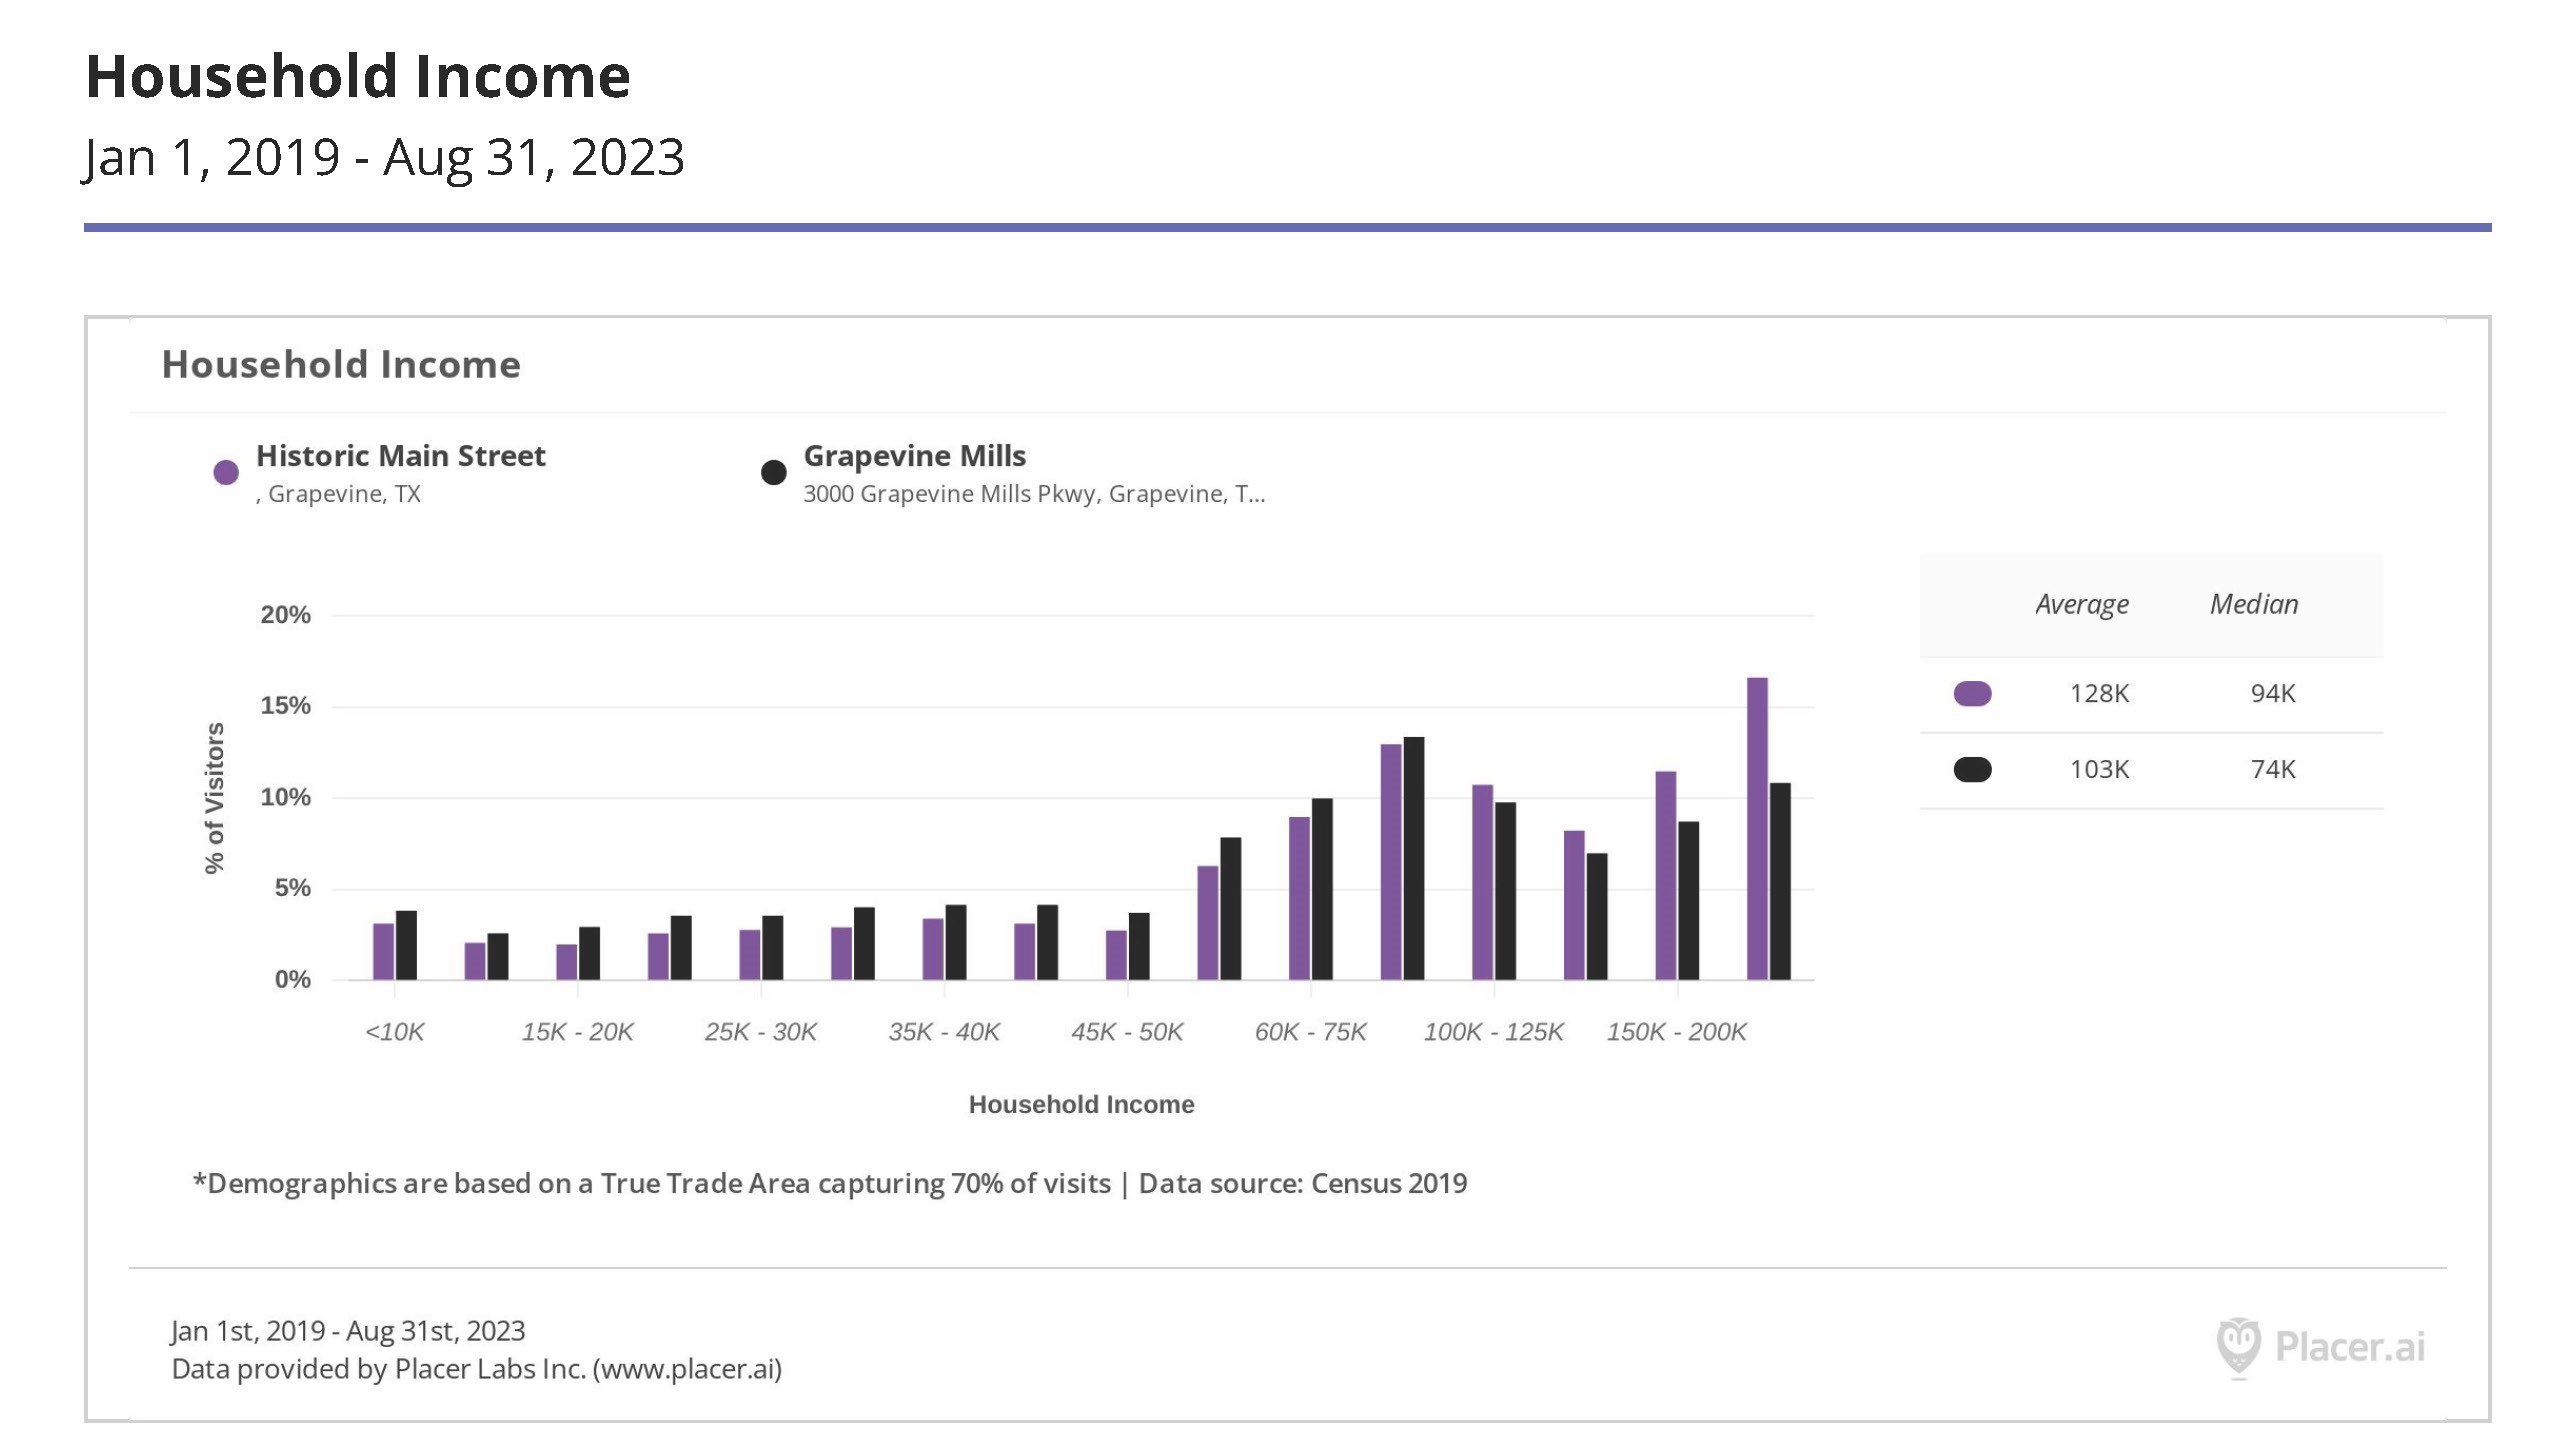
What it is: A percentage breakdown of average household income within the estimated trade area for both locations, based on data accumulated during the window in question.
What it means: There’s plenty of spending power to support both Grapevine Mills and Main Street, but each place has a niche. High-earners are more likely to choose Main Street, while savvy customers in search of the best deal will find more to like at Grapevine Mills. There’s plenty to love at both sites, though, so the distinction is really only noticeable at the very highest end of the spectrum.
Caveat: Placer prefers to use a percentage of estimated trade area profiles in demographic reporting, intentionally winnowing the sample size to 70% of visits to eliminate outliers. A perfect accounting of the demographics within any trade area isn’t possible.
Chart 12 – Overlapping Interests
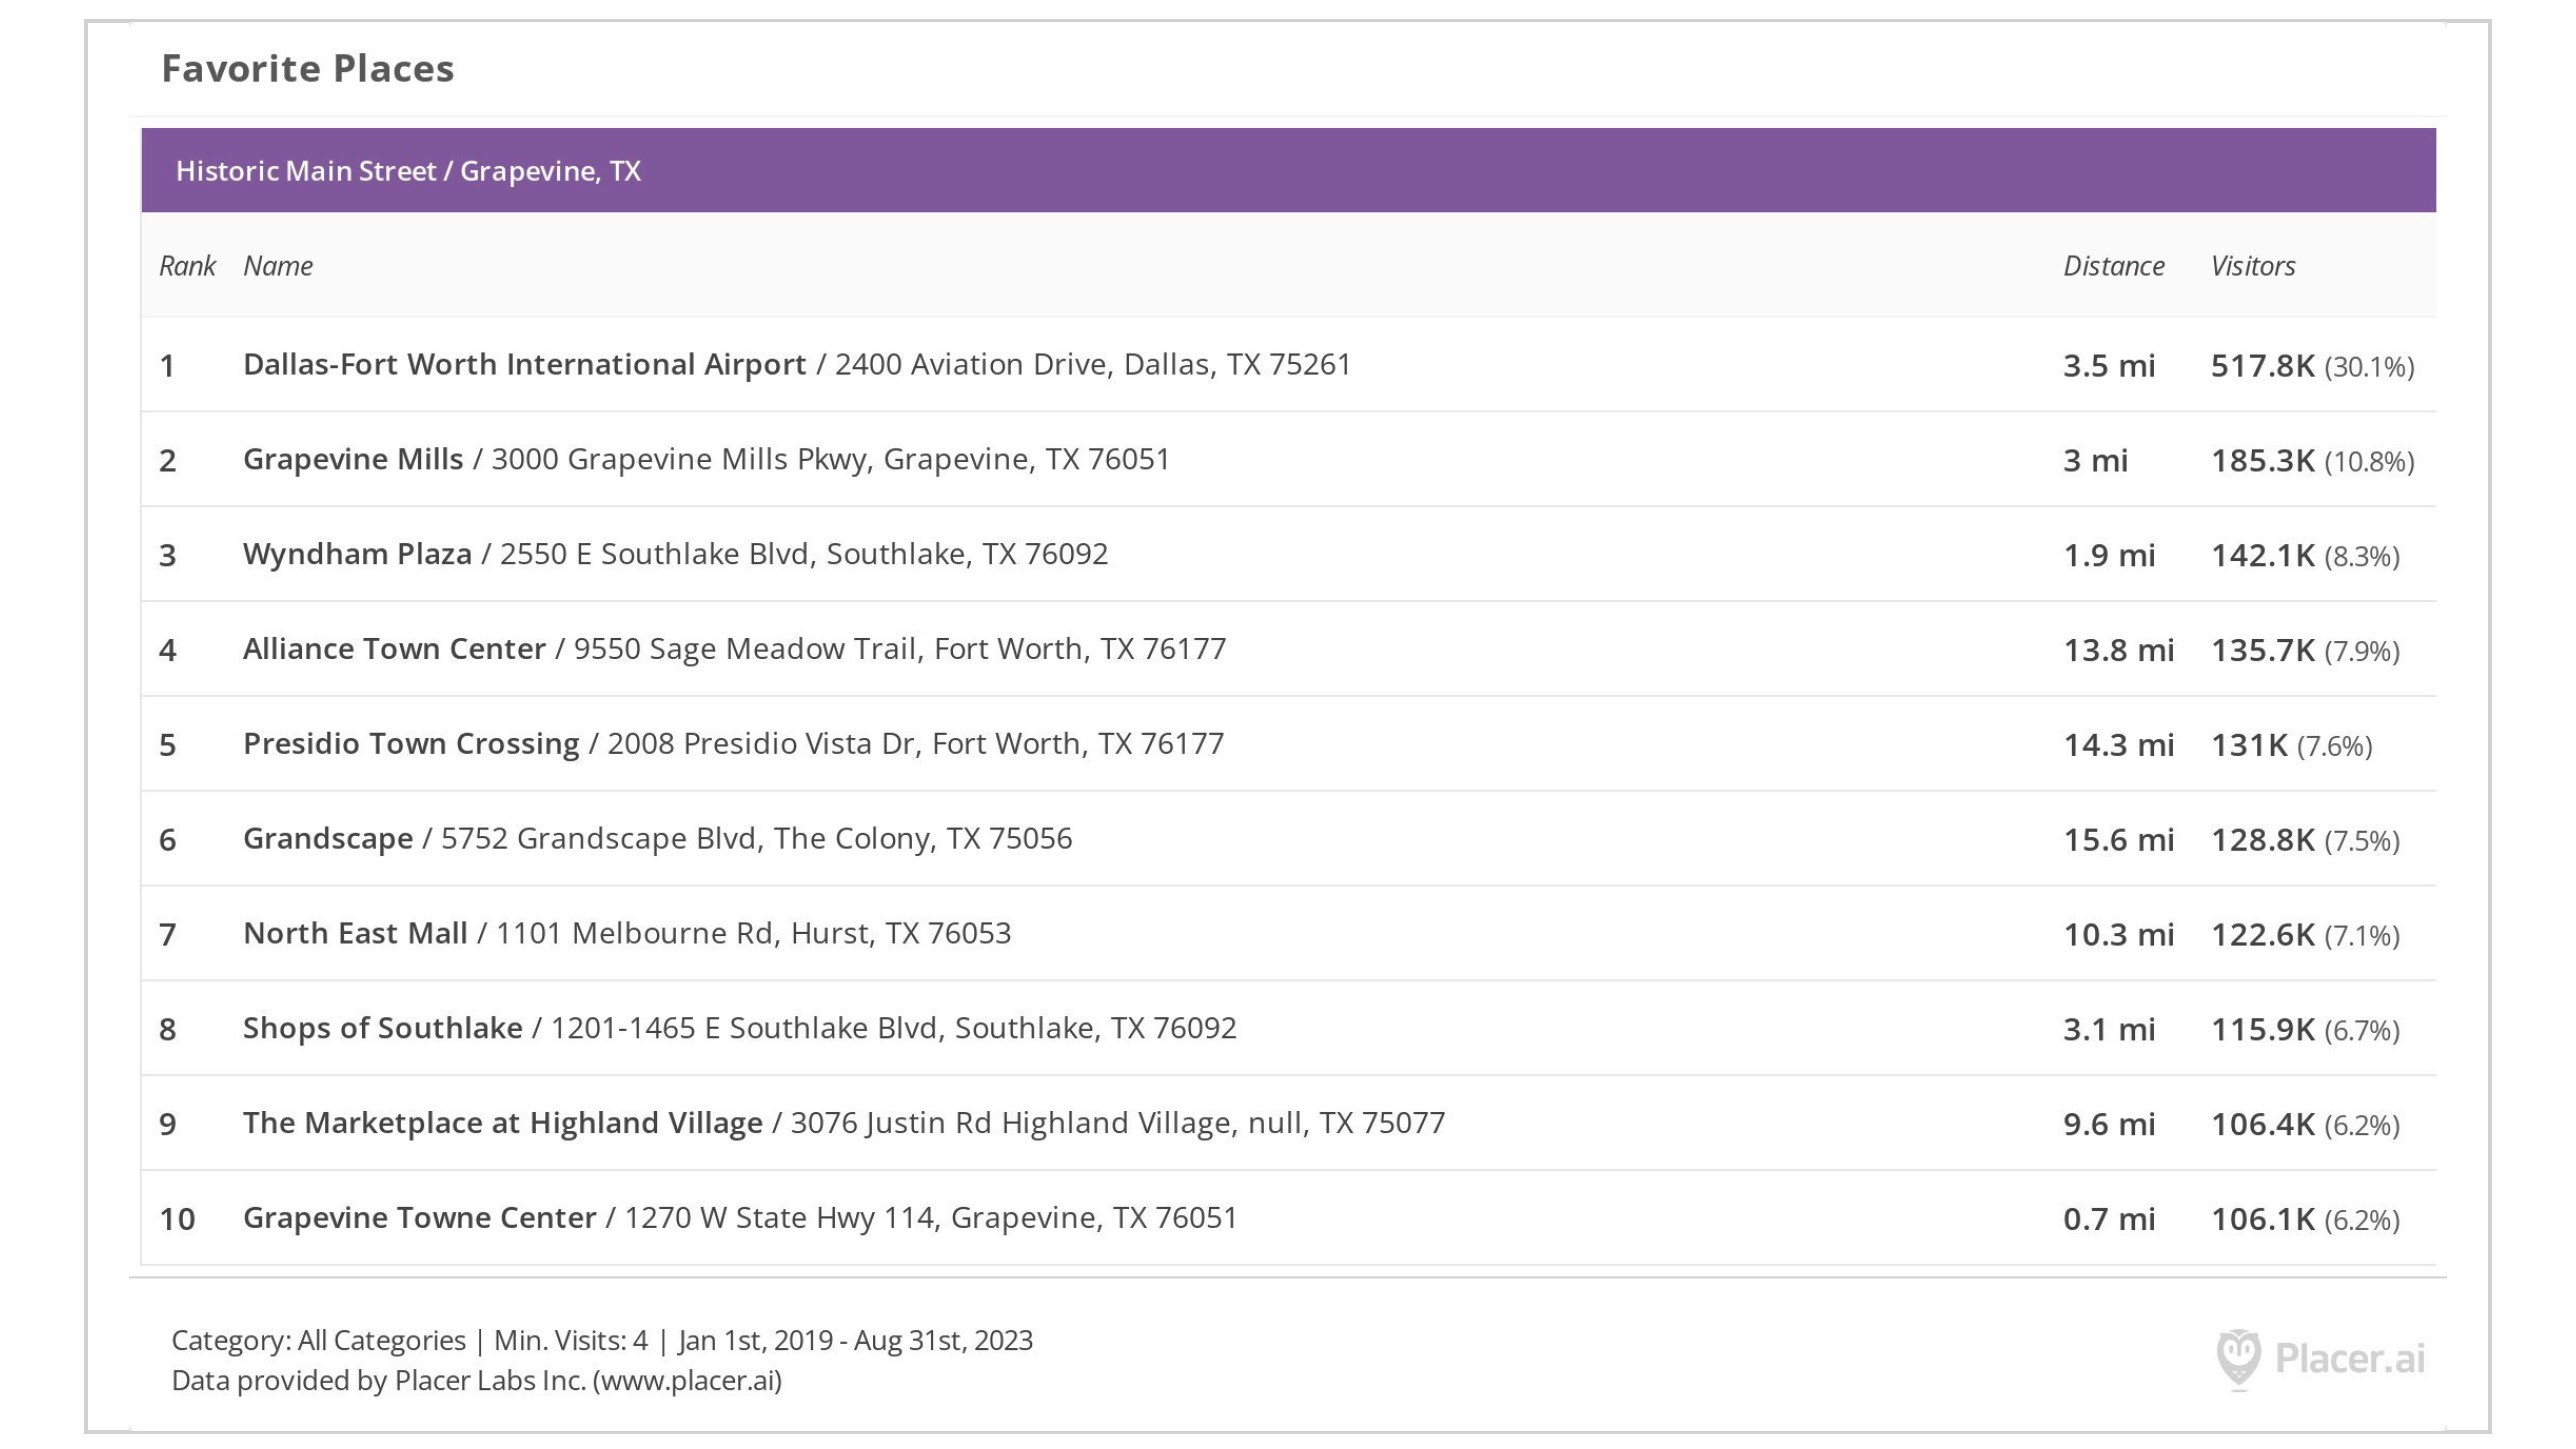
What it is: A list of places most commonly visited by customers on Main Street between January 2019 and August 2023, with a minimum of four visits (roughly one/year) required.
What it means: There’s a strong crossover between Main Street and Grapevine Mills. About 10% of visitors to Main Street will also drop by the Mills at some point (although, as evidenced by Chart #8, they rarely go straight there). The only other location favored to that degree is DFW International Airport, with a collection of local shopping centers closer to home filling out the list.
Caveat: This is a correlation, not a causation. Just because 10% of folks who walked Main Street also visited Grapevine Mills at some point in the survey window doesn’t necessarily mean the two trips were linked; just that both places earned their interest.
With systems as large and complex as a City-wide economy, even the most granular data can only tell part of the story. While we hope you found the insights above to be useful and interesting, Grapevine Economic Development invites you to learn more about our incredible community by seeing it for yourself! For more information, you can subscribe to the ‘Growing Grapevine’ eNewsletter and Podcast, explore detailed data on the whole community, or reach out to us directly with questions.
More Topics